Toyota 2011 Annual Report Download - page 83
Download and view the complete annual report
Please find page 83 of the 2011 Toyota annual report below. You can navigate through the pages in the report by either clicking on the pages listed below, or by using the keyword search tool below to find specific information within the annual report.-
 1
1 -
2
-
3
-
4
-
5
-
6
-
7
-
8
-
9
-
10
-
11
-
12
-
13
-
14
-
15
-
16
-
17
-
18
-
19
-
20
-
21
-
22
-
23
-
24
-
25
-
26
-
27
-
28
-
29
-
30
-
31
-
32
-
33
-
34
-
35
-
36
-
37
-
38
-
39
-
40
-
41
-
42
-
43
-
44
-
45
-
46
-
47
-
48
-
49
-
50
-
51
-
52
-
53
-
54
-
55
-
56
-
57
-
58
-
59
-
60
-
61
-
62
-
63
-
64
-
65
-
66
-
67
-
68
-
69
-
70
-
71
-
72
-
 73
73 -
 74
74 -
 75
75 -
 76
76 -
 77
77 -
 78
78 -
 79
79 -
 80
80 -
 81
81 -
 82
82 -
 83
83 -
 84
84 -
 85
85 -
 86
86 -
 87
87 -
 88
88 -
 89
89 -
 90
90 -
 91
91 -
 92
92 -
 93
93 -
94
-
95
-
96
-
97
-
98
-
99
-
100
-
101
-
102
-
103
-
104
-
105
-
106
-
107
-
108
-
109
-
110
-
111
-
112
-
113
 |
 |

Other receivables:
8
Inventories:
9
Vehicles and equipment on operating leases:
10
0822
Financial Section and
Investor Information
Business and
Performance Review
Special FeatureMessage/Vision
Management and
Corporate Information
Notes to Consolidated Financial Statements
Yen in millions
March 31, 2011
Wholesale Real estate
Working capital
Total
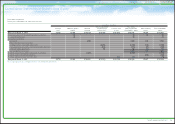
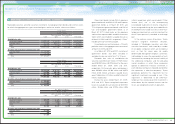
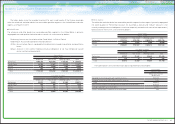
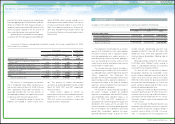
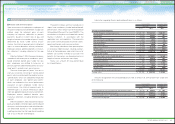
Impaired finance receivables with specific reserves
¥ 7,192 ¥18,173 ¥4,841 ¥30,206
Impaired finance receivables without specific reserves
12,745 — 272 13,017
Total ¥19,937 ¥18,173 ¥5,113 ¥43,223
Allowance for credit losses recorded for impaired
finance receivables ¥ 896 ¥ 6,553 ¥3,436 ¥10,885
Average impaired finance receivables 16,231 19,545 4,979 40,755
Interest recognized on impaired finance receivables
171 514 86 771
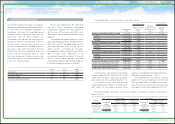
U.S. dollars in millions
March 31, 2011
Wholesale Real estate
Working capital
Total
Impaired finance receivables with specific reserves
$ 86 $219 $58 $363
Impaired finance receivables without specific reserves
154 — 3 157
Total $240 $219 $61 $520
Allowance for credit losses recorded for impaired
finance receivables $ 11 $ 79 $41 $131
Average impaired finance receivables 195 235 60 490
Interest recognized on impaired finance receivables
2 6 1 9
The recorded investment in impaired finance receivables is equal to the unpaid principal balance.
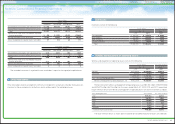
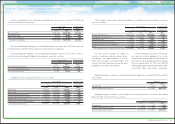
Other receivables relate to arrangements with certain component manufacturers whereby Toyota procures
inventory for these component manufactures and is reimbursed for the related purchases.
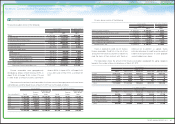
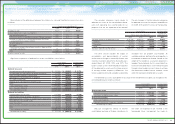
Inventories consist of the following:
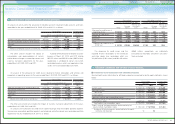
Vehicles and equipment on operating leases consist of the following:
Rental income from vehicles and equipment on operating leases was ¥560,251 million, ¥496,729 million
and ¥475,472 million ($5,718 million) for the years ended March 31, 2009, 2010 and 2011, respectively.
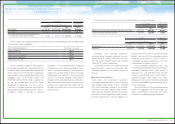
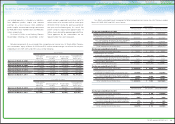
Future minimum rentals from vehicles and equipment on operating leases are due in installments as follows:
The future minimum rentals as shown above should not be considered indicative of future cash collections.
Yen in millions
U.S. dollars in millions
March 31, March 31,
2010 2011 2011
Finished goods ¥ 885,005 ¥ 715,272 $ 8,602
Raw materials 265,493 299,755 3,605
Work in process 199,267 218,335 2,626
Supplies and other 72,608 70,880 852
Total ¥1,422,373 ¥1,304,242 $15,685
Yen in millions
U.S. dollars in millions
March 31, March 31,
2010 2011 2011
Vehicles ¥2,516,948 ¥2,404,032 $28,912
Equipment 96,300 87,914 1,057
2,613,248 2,491,946 29,969
Less - Accumulated depreciation (791,169) (662,255) (7,964)
Vehicles and equipment on operating leases, net ¥1,822,079 ¥1,829,691 $22,005
Years ending March 31, Yen in millions
U.S. dollars in millions
2012 ¥375,712 $4,518
2013 256,231 3,082
2014 110,583 1,330
2015 26,645 320
2016 6,547 79
Thereafter 5,487 66
Total minimum future rentals ¥781,205 $9,395
83
TOYOTA ANNUAL REPORT 2011