Toyota 2011 Annual Report Download - page 107
Download and view the complete annual report
Please find page 107 of the 2011 Toyota annual report below. You can navigate through the pages in the report by either clicking on the pages listed below, or by using the keyword search tool below to find specific information within the annual report.-
 1
1 -
2
-
3
-
4
-
5
-
6
-
7
-
8
-
9
-
10
-
11
-
12
-
13
-
14
-
15
-
16
-
17
-
18
-
19
-
20
-
21
-
22
-
23
-
24
-
25
-
26
-
27
-
28
-
29
-
30
-
31
-
32
-
33
-
34
-
35
-
36
-
37
-
38
-
39
-
40
-
41
-
42
-
43
-
44
-
45
-
46
-
47
-
48
-
49
-
50
-
51
-
52
-
53
-
54
-
55
-
56
-
57
-
58
-
59
-
60
-
61
-
62
-
63
-
64
-
65
-
66
-
67
-
68
-
69
-
70
-
71
-
72
-
73
-
74
-
75
-
76
-
77
-
78
-
79
-
80
-
81
-
82
-
83
-
84
-
85
-
86
-
87
-
88
-
89
-
90
-
91
-
92
-
93
-
94
-
95
-
96
-
 97
97 -
 98
98 -
 99
99 -
 100
100 -
 101
101 -
 102
102 -
 103
103 -
 104
104 -
 105
105 -
 106
106 -
 107
107 -
 108
108 -
 109
109 -
 110
110 -
 111
111 -
 112
112 -
 113
113
 |
 |

Per share amounts:
25
Fair value measurements:
26
0822
Financial Section and
Investor Information
Business and
Performance Review
Special FeatureMessage/Vision
Management and
Corporate Information
Notes to Consolidated Financial Statements
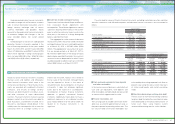
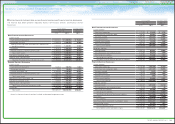
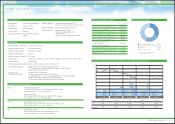
Reconciliations of the differences between basic and diluted net income (loss) attributable to Toyota Motor
Corporation per share for the years ended March 31, 2009, 2010 and 2011 are as follows:
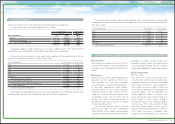
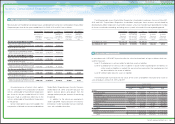
The following table shows Toyota Motor Corporation shareholders’ equity per share as of March 31,
2010 and 2011. Toyota Motor Corporation shareholders’ equity per share amounts are calculated by
dividing Toyota Motor Corporation shareholders’ equities’ amount at the end of each period by the number
of shares issued and outstanding, excluding treasury stock at the end of the corresponding period.
Yen in millions
Thousands of shares
Yen
U.S. dollars in millions
U.S. dollars
Net income (loss)
attributable to
Toyota Motor
Corporation
Weighted-average
shares
Net income (loss)
attributable to
Toyota Motor
Corporation per
share
Net income
attributable to
Toyota Motor
Corporation
Net income
attributable to
Toyota Motor
Corporation per
share
For the year ended March 31, 2009
Basic net loss attributable to Toyota
Motor Corporation per common share
¥(436,937) 3,140,417 ¥(139.13)
Effect of dilutive securities
Assumed exercise of dilutive stock options
(0) ―
Diluted net loss attributable to Toyota
Motor Corporation per common share
¥(436,937) 3,140,417 ¥(139.13)
For the year ended March 31, 2010
Basic net income attributable to Toyota
Motor Corporation per common share
¥ 209,456 3,135,986 ¥ 66.79
Effect of dilutive securities
Assumed exercise of dilutive stock options
―12
Diluted net income attributable to Toyota
Motor Corporation per common share
¥ 209,456 3,135,998 ¥ 66.79
For the year ended March 31, 2011
Basic net income attributable to Toyota
Motor Corporation per common share
¥ 408,183 3,135,881 ¥ 130.17 $4,909 $1.57
Effect of dilutive securities
Assumed exercise of dilutive stock options
(0) 34 (0)
Diluted net income attributable to Toyota
Motor Corporation per common share
¥ 408,183 3,135,915 ¥ 130.16 $4,909 $1.57
Assumed exercise of certain stock options
was not included in the computation of diluted
net loss attributable to Toyota Motor Corporation
per share for the year ended March 31, 2009
because it had an antidilutive effect due to the
net loss attributable to Toyota Motor Corporation
for the period.
Certain stock options were not included in the
computation of diluted net income attributable to
Toyota Motor Corporation per share for the years
ended March 31, 2010 and 2011 because the
options’ exercise prices were greater than the
average market price per common share during
the period.
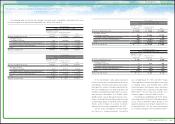
In addition to the disclosure requirements
under U.S.GAAP, Toyota discloses the informa-
tion below in order to provide financial statement
users with valuable information.
In accordance with U.S.GAAP, Toyota classifies fair value into three levels of input as follows which are
used to measure it.
Level 1: Quoted prices in active markets for identical assets or liabilities
Level 2: Quoted prices for similar assets or liabilities in active markets; quoted prices for identical or
similar assets or liabilities in markets that are not active; inputs other than quoted prices that
are observable for the assets or liabilities
Level 3: Unobservable inputs for assets or liabilities
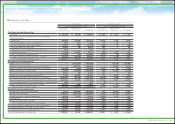
The following table summarizes the fair values of the assets and liabilities measured at fair value on
a recurring basis at March 31, 2010 and 2011:
Yen in millions
Thousands of shares
Yen
U.S. dollars in millions
U.S. dollars
Toyota Motor
Corporation
Shareholders’
equity
Shares issued
and outstanding
at the end of the
year (excluding
treasury stock)
Toyota Motor
Corporation
Shareholders’
equity per share
Toyota Motor
Corporation
Shareholders’
equity
Toyota Motor
Corporation
Shareholders’
equity per share
As of March 31, 2010 ¥10,359,723 ¥3,135,995 ¥3,303.49
As of March 31, 2011 10,332,371 3,135,699 3,295.08 $124,262 $39.63
Yen in millions
March 31, 2010
Level 1 Level 2 Level 3 Total
Assets
Cash equivalents ¥ 677,442 ¥ 69,702 ¥ ―¥ 747,144
Time deposits ―173,500 ―173,500
Marketable securities and other securities investments
Government bonds 2,654,829 ― ― 2,654,829
Common stocks 852,775 ― ― 852,775
Other 37,296 370,933 13,134 421,363
Derivative financial instruments ―349,556 19,437 368,993
Total ¥4,222,342 ¥ 963,691 ¥ 32,571 ¥5,218,604
Liabilities
Derivative financial instruments ¥
―¥(259,184) ¥(13,545) ¥ (272,729)
Total ¥
―¥(259,184) ¥(13,545) ¥ (272,729)
107
TOYOTA ANNUAL REPORT 2011