Toyota 2011 Annual Report Download - page 53
Download and view the complete annual report
Please find page 53 of the 2011 Toyota annual report below. You can navigate through the pages in the report by either clicking on the pages listed below, or by using the keyword search tool below to find specific information within the annual report.-
 1
1 -
2
-
3
-
4
-
5
-
6
-
7
-
8
-
9
-
10
-
11
-
12
-
13
-
14
-
15
-
16
-
17
-
18
-
19
-
20
-
21
-
22
-
23
-
24
-
25
-
26
-
27
-
28
-
29
-
30
-
31
-
32
-
33
-
34
-
35
-
36
-
37
-
38
-
39
-
40
-
41
-
42
-
 43
43 -
 44
44 -
 45
45 -
 46
46 -
 47
47 -
 48
48 -
 49
49 -
 50
50 -
 51
51 -
 52
52 -
 53
53 -
 54
54 -
 55
55 -
 56
56 -
 57
57 -
 58
58 -
 59
59 -
 60
60 -
 61
61 -
 62
62 -
 63
63 -
64
-
65
-
66
-
67
-
68
-
69
-
70
-
71
-
72
-
73
-
74
-
75
-
76
-
77
-
78
-
79
-
80
-
81
-
82
-
83
-
84
-
85
-
86
-
87
-
88
-
89
-
90
-
91
-
92
-
93
-
94
-
95
-
96
-
97
-
98
-
99
-
100
-
101
-
102
-
103
-
104
-
105
-
106
-
107
-
108
-
109
-
110
-
111
-
112
-
113
 |
 |
0822
Financial Section and
Investor Information
Business and
Performance Review
Special FeatureMessage/Vision
Management and
Corporate Information
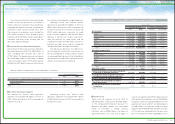
Management's Discussion and Analysis of Financial Condition and Results of Operations
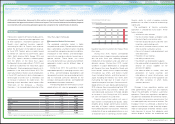
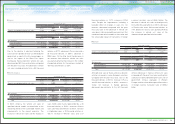
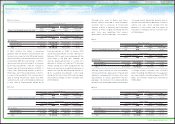
North America
Europe
Yen in millions
2011 vs. 2010
Change
Changes in operating income and loss:
Effect of fluctuation in foreign
currency translation rates ¥ 1,400
Effect of cost reduction efforts,
decrease in miscellaneous costs
and others 44,703
Total ¥46,103
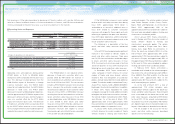
the ¥330.0 billion unfavorable impact of fluctuations
in foreign currency translation rates and the ¥50.0
billion increase in miscellaneous costs and others,
partially offset by the ¥140.0 billion impact of cost
reduction efforts in automotive operations. The
¥50.0 billion increase in miscellaneous costs and
others includes the ¥20.0 billion increase in costs
related to the Great East Japan Earthquake.
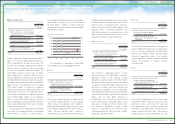
The increase in operating losses in Japan was due
to the ¥252.2 billion increase in cost reduction
efforts, increase in miscellaneous costs and others,
partially offset by the ¥115.0 billion impact of increase
in the number of exported vehicles for the overseas
market. The cost reduction efforts, increase in
miscellaneous costs and others were mainly due to
The increase in operating income in North
America was due to the ¥130.0 billion increase in
operating income in the financial services
operations including impacts of the ¥100.0 billion
decrease in the provision for credit losses and net
charge-offs and the ¥30.0 billion decrease in the
provision for residual value losses primarily for
sales finance subsidiaries in the United States,
the ¥105.0 billion impact of increase in production
volume, the ¥30.0 billion impact of cost reduction
efforts, and the ¥15.0 billion decrease in
miscellaneous costs and others, partially offset
by the ¥23.8 billion unfavorable impact of the
fluctuations in foreign currency translation rates.
The increase in production volume in North
America is attributable to the increase in local
vehicle production by 296 thousands of RAV4,
Highlander and other models.
The increase in operating income in Europe was
due to the ¥30.0 billion decrease in miscellaneous
costs in automotive operations, the ¥5.0 billion
effect of cost reduction efforts, the ¥5.0 billion
increase in operating income in the financial
services operations, and the ¥1.4 billion favorable
impact of fluctuations in foreign currency
translation rates.
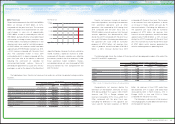
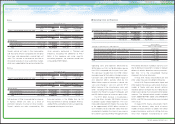
The increase in operating income in Asia was due
to the ¥105.0 billion impact of increases in both
production volume and vehicle unit sales and
other operational factors, partially offset by the
¥5.9 billion unfavorable impact of fluctuations in
foreign currency translation rates. The increases
in both production volume and vehicle unit sales
Yen in millions
2011 vs. 2010
Change
Changes in operating income and loss:
Effect of increase in production volume
and other operational factors
¥105,000
Effect of fluctuation in foreign
currency translation rates (23,800)
Effect of financial services operations,
cost reduction efforts, decrease in
miscellaneous costs and others
172,813
Total ¥254,013 Asia
Yen in millions
2011 vs. 2010
Change
Changes in operating income and loss:
Effect of increase in production
volume and vehicle unit sales and
other operational factors ¥105,000
Effect of fluctuation in foreign
currency translation rates (5,900)
Effect of cost reduction efforts, decrease
in miscellaneous costs and others
10,350
Total ¥109,450
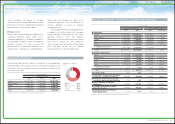
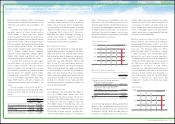
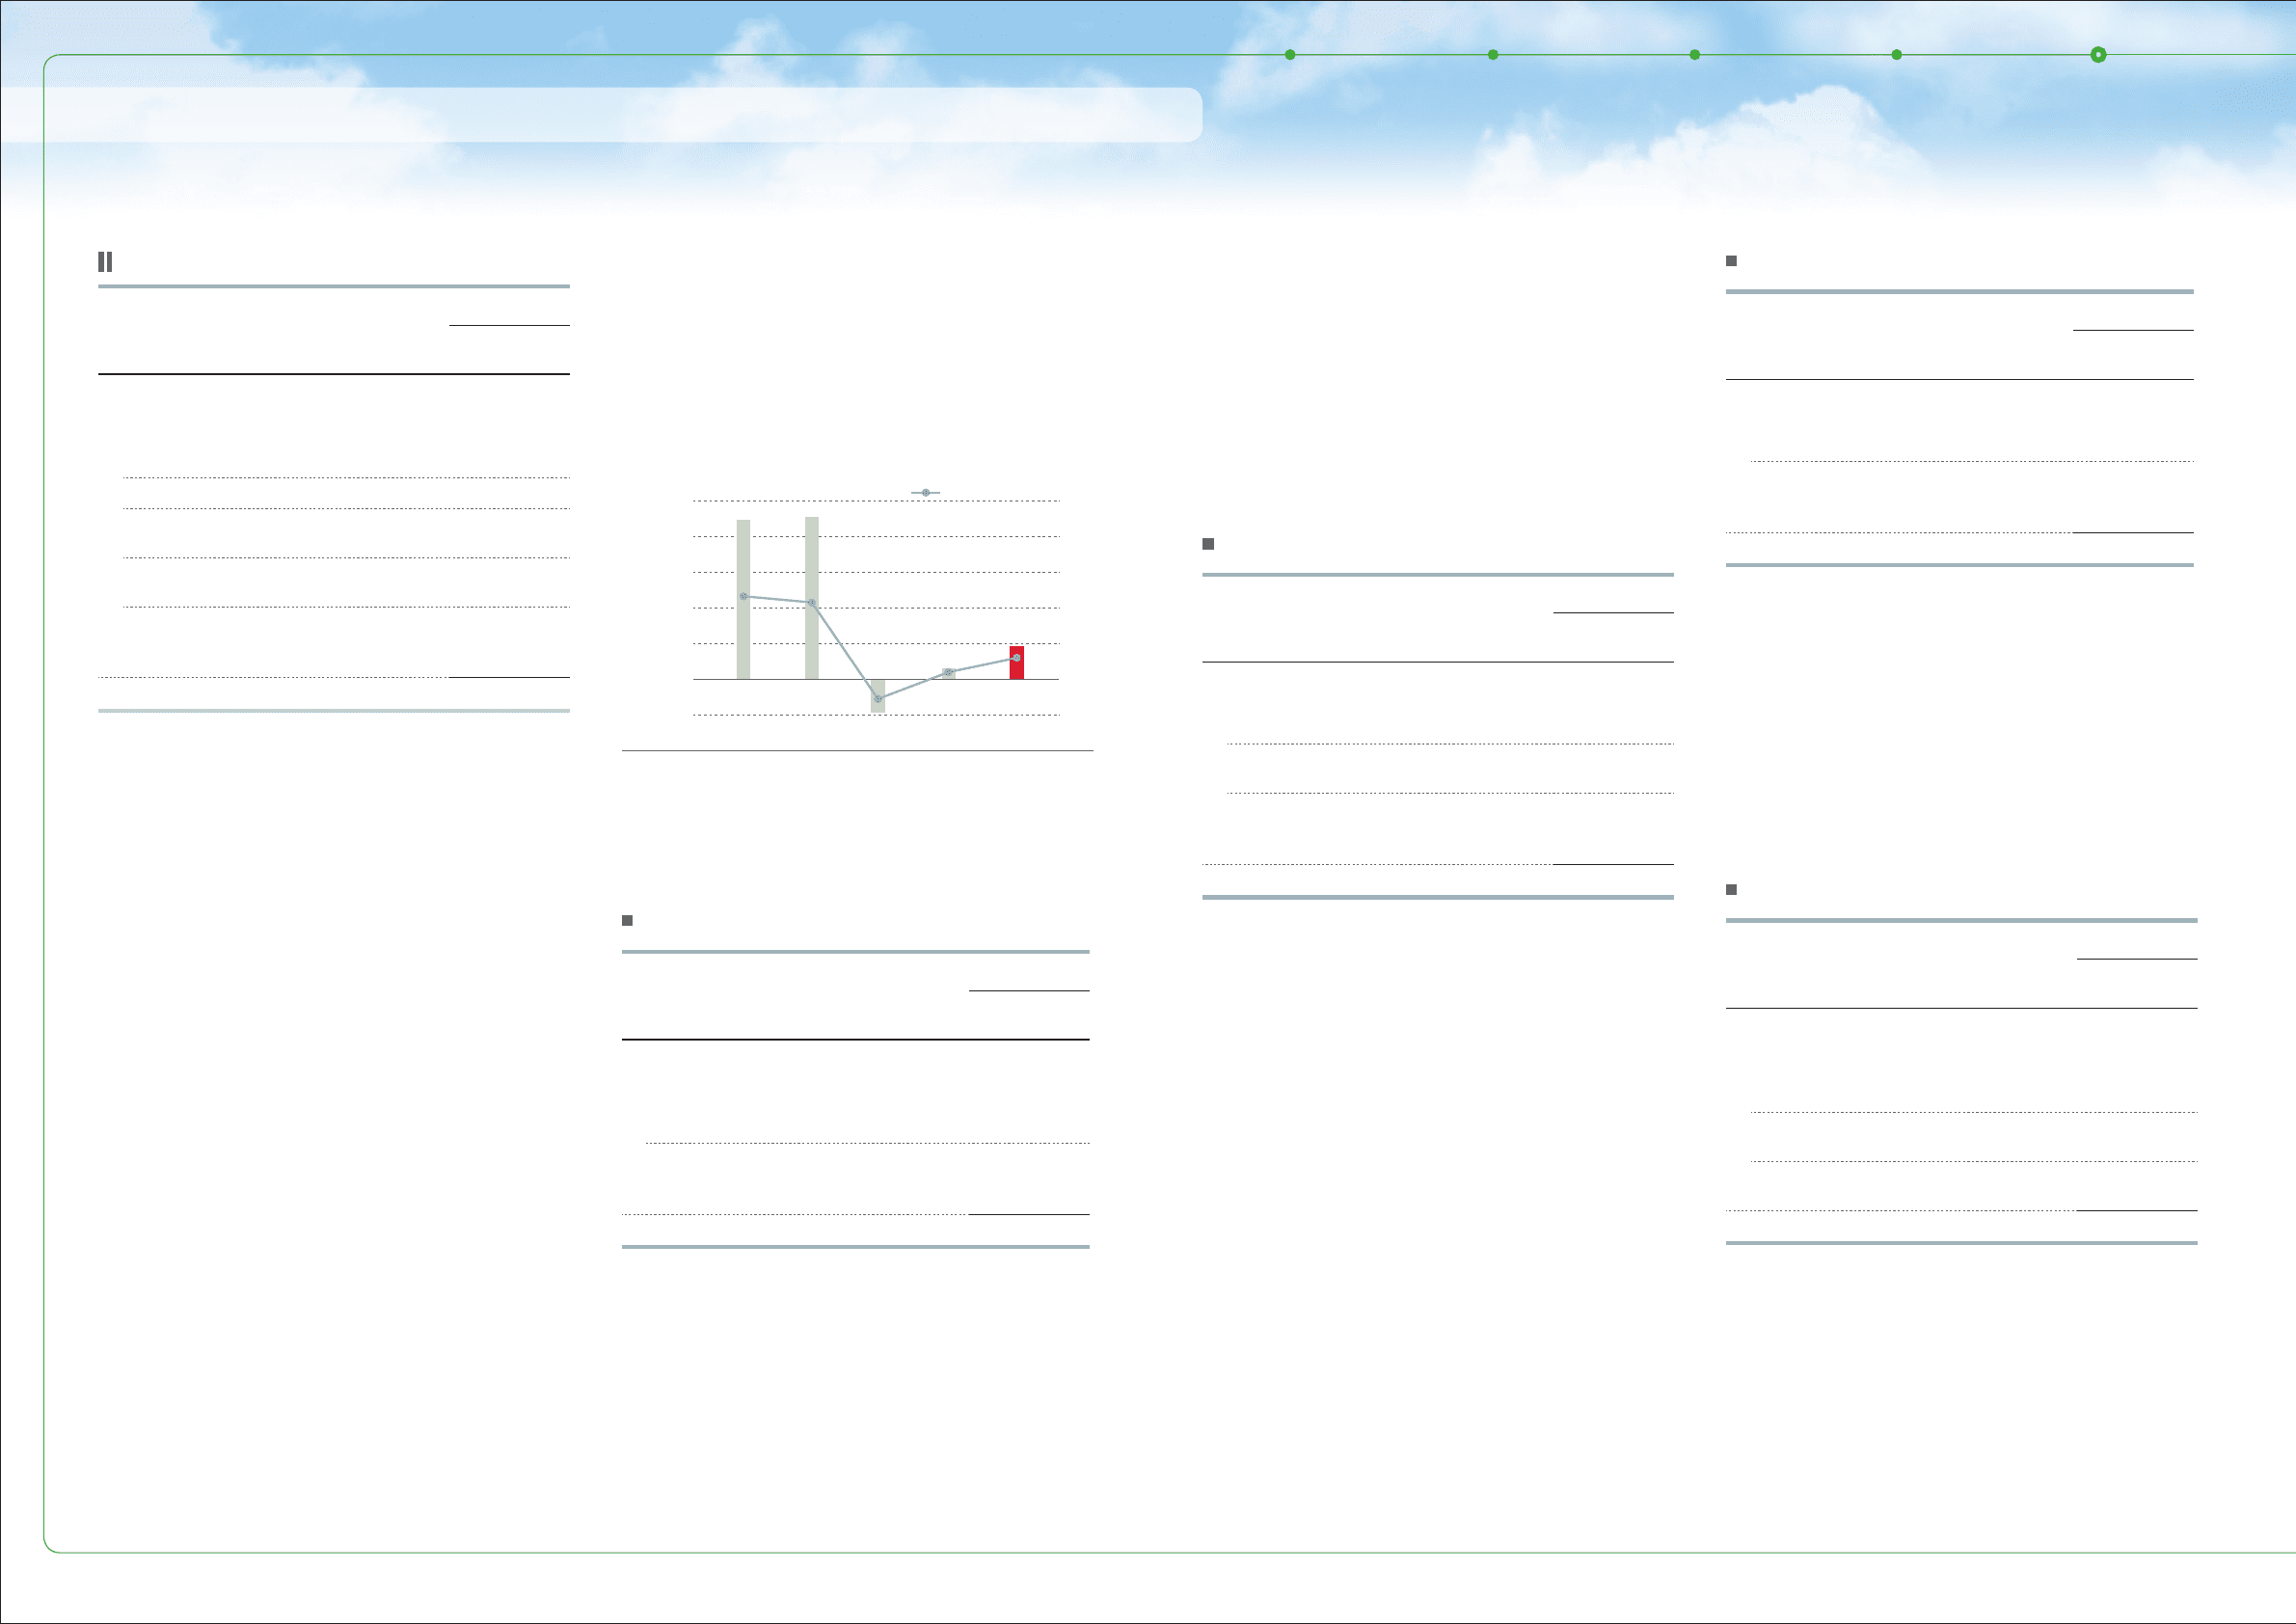
Toyota’s operating income increased by ¥320.7
billion, or 217.4%, to ¥468.2 billion during fiscal
2011 compared with the prior fiscal year. This
increase was favorably impacted by the ¥300.0
billion increase in vehicle unit sales and changes
in sales mix and other operational factors, the
¥54.4 billion increase in parts sales, the ¥32.6
billion impact of cost reduction efforts, financial
services operations, and others, partially offset by
the ¥36.2 billion unfavorable impact of fluctuations
in foreign currency translation rates, and the ¥30.0
billion increase in miscellaneous costs including
¥20.0 billion impact of increase in expenses
related to the Great East Japan Earthquake. The
¥32.6 billion increase of cost reduction efforts,
financial services operations, and others was due
to the ¥180.0 billion impact of cost reduction
efforts and the ¥130.0 billion impact of financial
services operations, partially offset by the ¥290.0
billion unfavorable impact of fluctuations in foreign
currency translation rates.
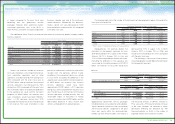
During fiscal 2011, operating income (before
elimination of intersegment profits), increased by
¥254.1 billion, or 297.1%, in North America,
The following is a description of operating
income and loss in each geographic market.
increased by ¥46.1 billion in Europe, increased by
¥109.4 billion, or 53.8%, in Asia, and increased
by ¥44.6 billion, or 38.6%, in Other compared
with the prior fiscal year, whereas it decreased by
¥137.2 billion in Japan.
Operating Income
Yen in millions
2011 vs. 2010
Change
Changes in operating income and loss:
Effect of increase in vehicle unit sales
and changes in sales mix and other
operational factors
¥300,000
Effect of increase in parts sales 54,400
Effect of fluctuation in foreign
currency translation rates (36,200)
Effect of increase in miscellaneous
costs (30,000)
Effect of cost reduction efforts,
financial services operations, and
others 32,563
Total ¥320,763
Operating Income (Loss)
0
500
-5,000
1,000
1,500
2,000
2,500 20
16
12
8
4
0
-4
‘07 ‘11‘10‘09‘08
FY
% of net revenues
(Right scale)
(¥ Billion) (%)
Japan
Yen in millions
2011 vs. 2010
Change
Changes in operating income and loss:
Effect of increase in the number of
exported vehicles for the overseas
market and other operational factors
¥ 115,000
Effect of cost reduction efforts,
increase in miscellaneous costs
and others (252,154)
Total ¥(137,154)
53
TOYOTA ANNUAL REPORT 2011