Toyota 2011 Annual Report Download - page 109
Download and view the complete annual report
Please find page 109 of the 2011 Toyota annual report below. You can navigate through the pages in the report by either clicking on the pages listed below, or by using the keyword search tool below to find specific information within the annual report.-
 1
1 -
2
-
3
-
4
-
5
-
6
-
7
-
8
-
9
-
10
-
11
-
12
-
13
-
14
-
15
-
16
-
17
-
18
-
19
-
20
-
21
-
22
-
23
-
24
-
25
-
26
-
27
-
28
-
29
-
30
-
31
-
32
-
33
-
34
-
35
-
36
-
37
-
38
-
39
-
40
-
41
-
42
-
43
-
44
-
45
-
46
-
47
-
48
-
49
-
50
-
51
-
52
-
53
-
54
-
55
-
56
-
57
-
58
-
59
-
60
-
61
-
62
-
63
-
64
-
65
-
66
-
67
-
68
-
69
-
70
-
71
-
72
-
73
-
74
-
75
-
76
-
77
-
78
-
79
-
80
-
81
-
82
-
83
-
84
-
85
-
86
-
87
-
88
-
89
-
90
-
91
-
92
-
93
-
94
-
95
-
96
-
97
-
98
-
 99
99 -
 100
100 -
 101
101 -
 102
102 -
 103
103 -
 104
104 -
 105
105 -
 106
106 -
 107
107 -
 108
108 -
 109
109 -
 110
110 -
 111
111 -
 112
112 -
 113
113
 |
 |

0822
Financial Section and
Investor Information
Business and
Performance Review
Special FeatureMessage/Vision
Management and
Corporate Information
Notes to Consolidated Financial Statements
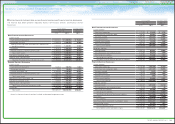
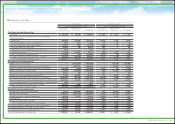
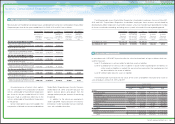
The following table summarizes the changes in Level 3 assets and liabilities measured at fair value
on a recurring basis for the periods ended March 31, 2009, 2010 and 2011:
Yen in millions
For the year ended March 31, 2009
Marketable securities
and other securities
investments
Derivative financial
instruments Total
Balance at beginning of year ¥23,818 ¥ 25,499 ¥ 49,317
Total gains (losses)
Included in earnings 586 (38,538) (37,952)
Included in other comprehensive income (loss) (1,398) — (1,398)
Purchases, issuances and settlements (1,665) 7,026 5,361
Other (1,760) 279 (1,481)
Balance at end of year ¥19,581 ¥ (5,734) ¥ 13,847
Yen in millions
For the year ended March 31, 2010
Marketable securities
and other securities
investments
Derivative financial
instruments Total
Balance at beginning of year ¥19,581 ¥ (5,734) ¥ 13,847
Total gains (losses)
Included in earnings (641) 25,057 24,416
Included in other comprehensive income (loss) (99) — (99)
Purchases, issuances and settlements (6,376) (13,582) (19,958)
Other 669 151 820
Balance at end of year ¥13,134 ¥ 5,892 ¥ 19,026
Yen in millions
For the year ended March 31, 2011
Marketable securities
and other securities
investments
Derivative financial
instruments Total
Balance at beginning of year ¥ 13,134 ¥ 5,892 ¥ 19,026
Total gains (losses)
Included in earnings 433 31,338 31,771
Included in other comprehensive income 779 — 779
Purchases, issuances and settlements (810) (8,381) (9,191)
Other (13,536) (22,055) (35,591)
Balance at end of year ¥ — ¥ 6,794 ¥ 6,794
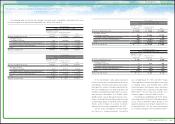
U.S. dollars in millions
For the year ended March 31, 2011
Marketable securities
and other securities
investments
Derivative financial
instruments Total
Balance at beginning of year $ 158 $ 71 $ 229
Total gains (losses)
Included in earnings 5 377 382
Included in other comprehensive income 10 — 10
Purchases, issuances and settlements (10) (101) (111)
Other (163) (265) (428)
Balance at end of year $ — $ 82 $ 82
In the reconciliation table above, derivative
financial instruments are presented net of assets
and liabilities. The other amount primarily includes
the impact of currency translation adjustments for
the years ended March 31, 2009 and 2010 and
includes consolidated retained interests in securi-
tized financial receivables of ¥(13,165) million
($(158) million), certain derivative financial instru-
ments transferred into Level 2 due to be measured
at observable inputs of ¥(21,413) million ($(258)
million) and the impact of currency translation
adjustments for the year ended March 31, 2011.
Certain assets and liabilities are measured at
fair value on a nonrecurring basis. During the
years ended March 31, 2010 and 2011, Toyota
measured certain finance receivables at fair value
of ¥13,343 million and ¥15,893 million ($191
million) based on the collateral value, resulting in
loss of ¥2,485 million and gain of ¥2,083 million
($25 million). This fair value measurement on a
nonrecurring basis was classified as level 3.
During the year ended March 31, 2010, Toyota
measured certain investment in affiliated company
at fair value of ¥119,821 million based on the
quoted market price resulting in impairment loss
of ¥63,575 million. This fair value measurement
on a nonrecurring basis was classified as level 1.
109
TOYOTA ANNUAL REPORT 2011