Toyota 2011 Annual Report Download - page 59
Download and view the complete annual report
Please find page 59 of the 2011 Toyota annual report below. You can navigate through the pages in the report by either clicking on the pages listed below, or by using the keyword search tool below to find specific information within the annual report.-
 1
1 -
2
-
3
-
4
-
5
-
6
-
7
-
8
-
9
-
10
-
11
-
12
-
13
-
14
-
15
-
16
-
17
-
18
-
19
-
20
-
21
-
22
-
23
-
24
-
25
-
26
-
27
-
28
-
29
-
30
-
31
-
32
-
33
-
34
-
35
-
36
-
37
-
38
-
39
-
40
-
41
-
42
-
43
-
44
-
45
-
46
-
47
-
48
-
 49
49 -
 50
50 -
 51
51 -
 52
52 -
 53
53 -
 54
54 -
 55
55 -
 56
56 -
 57
57 -
 58
58 -
 59
59 -
 60
60 -
 61
61 -
 62
62 -
 63
63 -
 64
64 -
 65
65 -
 66
66 -
 67
67 -
 68
68 -
 69
69 -
70
-
71
-
72
-
73
-
74
-
75
-
76
-
77
-
78
-
79
-
80
-
81
-
82
-
83
-
84
-
85
-
86
-
87
-
88
-
89
-
90
-
91
-
92
-
93
-
94
-
95
-
96
-
97
-
98
-
99
-
100
-
101
-
102
-
103
-
104
-
105
-
106
-
107
-
108
-
109
-
110
-
111
-
112
-
113
 |
 |

0822
Financial Section and
Investor Information
Business and
Performance Review
Special FeatureMessage/Vision
Management and
Corporate Information
Management's Discussion and Analysis of Financial Condition and Results of Operations
changes in sales mix, partially offset by the ¥9.0
billion impact of increases in parts sales. The
decrease in fixed costs was due mainly to the
¥178.7 billion decline in research and
development expenses and the ¥39.1 billion
decline in labor costs as a result of profit
improvement initiatives. The decrease in vehicle
unit sales and the changes in sales mix were due
to factors such as the substantial contraction of
the automotive market caused by the financial
crisis since the fall of 2008. The decrease in
research and development expenses is
attributable to reduced development costs
realized as a result of Toyota’s more focused
investment decisions for the future such as in
environmental technologies, and effective
management over research and development
expenses spending.
Cost of financing operations decreased by
¥275.1 billion, or 27.9%, to ¥712.3 billion during
fiscal 2010 compared with the prior year. The
decrease resulted primarily from the ¥83.5 billion
impact of fluctuations in foreign currency
translation rates, the ¥70.0 billion favorable
impact of changes in funding costs, the ¥64.5
billion recognition of valuation gains on interest
rate swaps stated at fair value, and the ¥50.0
billion decrease in provision for residual value
losses. The favorable impact of changes in
funding costs is attributable to a decline in market
interest rates. The decrease in provision for
residual value losses is primarily attributable to
the recovery of the used vehicles markets
particularly in the United States and other effects,
partially offset by the impact from the recalls and
other safety measures. Toyota judges this impact
does not have a material impact on Toyota’s
consolidated financial statements though it is
difficult to quantify the impact from the recalls
and other safety measures in residual value
losses accurately.
Selling, general and administrative expenses
decreased by ¥415.1 billion, or 16.4%, to ¥2,119.6
billion during fiscal 2010 compared with the prior
fiscal year. This decrease mainly reflects the
¥173.8 billion decrease for the financial services
operations and the ¥84.9 billion decrease of
marketing expense. The decrease in the financial
services operations is primarily due to the ¥140.0
billion decrease in provision for credit losses and
net charge-offs, which is attributable to the 0.46%
rise in the ratio of credit losses as a result of the
economic downturn mainly in the United States in
the prior fiscal year, partially offset by the ¥37.3
billion impact from the recalls and other safety
measures. The decrease in marketing expense is
attributable to reduced marketing costs realized
as a result of the profit improvement initiatives.
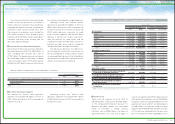
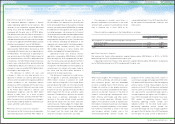
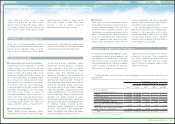
Cost of Financing Operations
Yen in millions
2010 vs. 2009
Change
Changes in cost of financing operations:
Effect of fluctuation in foreign
currency translation rates
¥ (83,500)
Effect of changes in funding costs (70,000)
Effect of increase in valuation gains
on interest rate swaps stated at
fair value (64,500)
Effect of decrease in provision for
residual value losses (50,000)
Other (7,083)
Total ¥(275,083)
Selling, General and Administrative Expenses
The following is a description of the customer
satisfaction measures related to certain Tacoma
pick-up trucks in North America referred to above.
In fiscal 2009, Toyota accrued the cost of the
customer satisfaction measures related to Tacoma
pick-up trucks in North America in order to
address the possibility of rust developing on the
frame of a portion of older model Tacoma pick-up
trucks manufactured in North America between
1995 and 2004, by rendering repair services for a
portion of the vehicles and providing warranty
extensions of up to 15 years to owners of
approximately 820 thousand vehicles, a portion
of which may include vehicle buyback.
Accordingly, the cost of approximately ¥130.0
billion was recorded in operating costs and
expenses in fiscal 2009. The repair ratio for these
customer satisfaction measures to date has been
relatively low due primarily to the low rate of
incidence of rust on the frames of these vehicles
which may occur when exposed to severe
environmental conditions including accumulation
of road salts. This low repair ratio was assumed in
the calculation of the accrual.
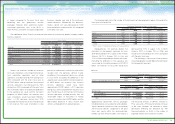
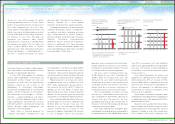
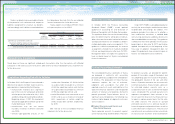
The net changes in the accrual for the
customer satisfaction measures related to Tacoma
pick-up trucks in North America described above
consist of the following:
During fiscal 2010, continued cost reduction
efforts reduced operating costs and expenses by
approximately ¥520.0 billion. The cost reduction
efforts include decreases in the prices of steel,
precious metals, non-ferrous alloys including
aluminum, plastic parts and other production
materials and parts. In fiscal 2010, the decline in
raw materials prices and, continued cost reduction
efforts, by working closely with suppliers,
contributed to the improvement in earnings.
These cost reduction efforts related to ongoing
value engineering and value analysis activities,
the use of common parts that result in a reduction
of part types and other manufacturing initiatives
designed to reduce the costs of vehicle
production.
Cost of products sold decreased by ¥1,496.9
billion, or 8.6%, to ¥15,971.5 billion during fiscal
2010 compared with the prior fiscal year. The
decrease resulted primarily from the ¥738.5
billion impact of fluctuations in foreign currency
translation rates, the ¥520.0 billion impact of cost
reduction efforts, the ¥159.4 billion of decrease
in fixed costs and other efforts including the
¥178.7 billion decrease in research and
development expenses, and the ¥88.0 billion
impact of the decrease in vehicle unit sales and
Yen in millions
Year ended March 31,
2010
Balance at the beginning of year
¥ —
Accrual 89,000
Amounts paid (32,400)
Balance at the end of year ¥ 56,600
Yen in millions
Year ended March 31,
2009 2010 2011
Balance at the
beginning of year
¥ — ¥ 57,500 ¥ 50,100
Accrual 130,000 21,000 —
Amounts paid (72,500) (28,400) (22,600)
Balance at the
end of year ¥ 57,500 ¥ 50,100 ¥ 27,500
Cost Reduction Efforts
Cost of Products Sold
59TOYOTA ANNUAL REPORT 2011