Toyota 2011 Annual Report Download - page 49
Download and view the complete annual report
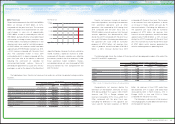
Please find page 49 of the 2011 Toyota annual report below. You can navigate through the pages in the report by either clicking on the pages listed below, or by using the keyword search tool below to find specific information within the annual report.-
 1
1 -
2
-
3
-
4
-
5
-
6
-
7
-
8
-
9
-
10
-
11
-
12
-
13
-
14
-
15
-
16
-
17
-
18
-
19
-
20
-
21
-
22
-
23
-
24
-
25
-
26
-
27
-
28
-
29
-
30
-
31
-
32
-
33
-
34
-
35
-
36
-
37
-
38
-
 39
39 -
 40
40 -
 41
41 -
 42
42 -
 43
43 -
 44
44 -
 45
45 -
 46
46 -
 47
47 -
 48
48 -
 49
49 -
 50
50 -
 51
51 -
 52
52 -
 53
53 -
 54
54 -
 55
55 -
 56
56 -
 57
57 -
 58
58 -
 59
59 -
60
-
61
-
62
-
63
-
64
-
65
-
66
-
67
-
68
-
69
-
70
-
71
-
72
-
73
-
74
-
75
-
76
-
77
-
78
-
79
-
80
-
81
-
82
-
83
-
84
-
85
-
86
-
87
-
88
-
89
-
90
-
91
-
92
-
93
-
94
-
95
-
96
-
97
-
98
-
99
-
100
-
101
-
102
-
103
-
104
-
105
-
106
-
107
-
108
-
109
-
110
-
111
-
112
-
113
 |
 |

0822
Financial Section and
Investor Information
Business and
Performance Review
Special FeatureMessage/Vision
Management and
Corporate Information
Management's Discussion and Analysis of Financial Condition and Results of Operations
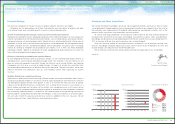
Toyota had net revenues for fiscal 2011 of ¥18,993.6
billion, an increase of ¥42.7 billion, or 0.2%,
compared with the prior fiscal year. This increase
reflects the impact of increased vehicle unit sales
and changes in sales mix of approximately
¥740.0 billion, as well as increased parts sales of
¥69.8 billion, partially offset by unfavorable impact
of fluctuations in foreign currency translation rates
of ¥801.3 billion. Excluding the difference in the
Japanese yen value used for translation purposes
of ¥801.3 billion, net revenues would have been
approximately ¥19,794.9 billion during fiscal 2011,
a 4.5% increase compared with the prior fiscal
year. The automotive market in fiscal 2011
contracted by 6.6% in Japan compared with the
prior fiscal year due to the decline in demand
following the conclusion of subsidies for
environmentally-friendly vehicles (“eco-car”)
offered by the government as a part of its stimulus
packages, as well as the impact of the Great East
Toyota’s net revenues include net revenues
from sales of products, consisting of net revenues
from automotive operations and all other
operations, that increased by 0.5% during fiscal
2011 compared with the prior fiscal year to
¥17,820.5 billion, and net revenues from financial
services operations that decreased by 4.3%
during fiscal 2011 compared with the prior fiscal
year to ¥1,173.1 billion. Excluding the difference in
the Japanese yen value used for translation
purposes of ¥724.1 billion, net revenues from
sales of products would have been ¥18,544.6
billion, a 4.6% increase during fiscal 2011
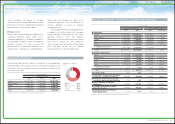
Geographically, net revenues (before the
elimination of intersegment revenues) for fiscal
2011 decreased by 2.1% in Japan, 4.3% in North
America, and 7.7% in Europe, whereas net
revenues increased by 27.1% in Asia and 8.1% in
Other compared with the prior fiscal year.
Excluding the difference in the Japanese yen
value used for translation purposes of ¥801.3
compared with the prior fiscal year. The increase
in net revenues from sales of products is due to
an increase in Toyota vehicle unit sales by 71
thousand vehicles. Excluding the difference in
the Japanese yen value used for translation
purposes of ¥77.2 billion, net revenues from
financial services operations would have been
approximately ¥1,250.3 billion, a 2.0% increase
during fiscal 2011 compared with the prior fiscal
year. This increase was mainly due to the increase
of ¥13.1 billion rental revenue generated by
vehicles and equipment on operating lease.
billion, net revenues in fiscal 2011 would have
decreased by 2.1% in Japan, and would have
increased by 3.6% in North America, 4.1% in
Europe, 29.7% in Asia and 11.0% in Other
compared with the prior fiscal year.
The following is a discussion of net revenues
in each geographic market (before the elimination
of intersegment revenues).
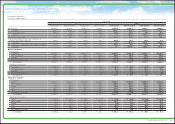
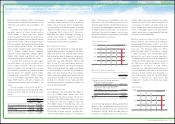
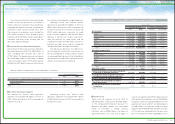
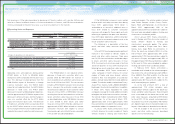
The table below shows Toyota’s net revenues from external customers by product category and by
business.
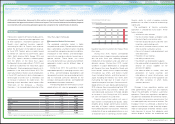
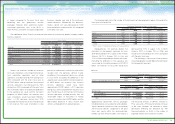
The following table shows the number of financing contracts by geographic region at the end of the
fiscal 2011 and 2010, respectively.
Japan Earthquake. However, the Asian automotive
market marked a significant increase of 27.6%
compared with the prior calendar year, reflecting
the recovery trend of the Asian economy. Under
these automotive market conditions, Toyota’s
consolidated vehicle unit sales increased to 7,308
thousand vehicles by 1.0% compared with the
prior fiscal year.
Net Revenues
0
5,000
10,000
15,000
20,000
25,000
FY ‘07 ‘11‘10‘09‘08
(¥ Billion)
Net Revenues
Yen in millions
Year ended March 31, 2011 vs. 2010 Change
2010 2011 Amount Percentage
Vehicles ¥14,309,595 ¥14,507,479 ¥ 197,884 +1.4%
Parts and components for overseas production
355,273 335,366 (19,907) −5.6%
Parts and components for after service 1,543,941 1,553,497 9,556 +0.6%
Other 978,499 926,411 (52,088) −5.3%
Total Automotive 17,187,308 17,322,753 135,445 +0.8%
All Other 537,421 497,767 (39,654) −7.4%
Total sales of products 17,724,729 17,820,520 95,791 +0.5%
Financial services 1,226,244 1,173,168 (53,076) −4.3%
Total ¥18,950,973 ¥18,993,688 ¥ 42,715 +0.2%
Numbers of financing contracts in thousands
Year ended March 31, 2011 vs. 2010 Change
2010 2011 Amount Percentage
Japan 1,684 1,709 25 +1.5%
North America 4,488 4,654 166 +3.7%
Europe 774 790 16 +2.0%
Asia 428 522 94 +22.1%
Other* 476 527 51 +10.7%
Total 7,850 8,202 352 +4.5%
* “Other” consists of Central and South America, Oceania and Africa.
49
TOYOTA ANNUAL REPORT 2011