Toyota 2011 Annual Report Download - page 71
Download and view the complete annual report
Please find page 71 of the 2011 Toyota annual report below. You can navigate through the pages in the report by either clicking on the pages listed below, or by using the keyword search tool below to find specific information within the annual report.-
 1
1 -
2
-
3
-
4
-
5
-
6
-
7
-
8
-
9
-
10
-
11
-
12
-
13
-
14
-
15
-
16
-
17
-
18
-
19
-
20
-
21
-
22
-
23
-
24
-
25
-
26
-
27
-
28
-
29
-
30
-
31
-
32
-
33
-
34
-
35
-
36
-
37
-
38
-
39
-
40
-
41
-
42
-
43
-
44
-
45
-
46
-
47
-
48
-
49
-
50
-
51
-
52
-
53
-
54
-
55
-
56
-
57
-
58
-
59
-
60
-
 61
61 -
 62
62 -
 63
63 -
 64
64 -
 65
65 -
 66
66 -
 67
67 -
 68
68 -
 69
69 -
 70
70 -
 71
71 -
 72
72 -
 73
73 -
 74
74 -
 75
75 -
 76
76 -
 77
77 -
 78
78 -
 79
79 -
 80
80 -
 81
81 -
82
-
83
-
84
-
85
-
86
-
87
-
88
-
89
-
90
-
91
-
92
-
93
-
94
-
95
-
96
-
97
-
98
-
99
-
100
-
101
-
102
-
103
-
104
-
105
-
106
-
107
-
108
-
109
-
110
-
111
-
112
-
113
 |
 |

0822
Financial Section and
Investor Information
Business and
Performance Review
Special FeatureMessage/Vision
Management and
Corporate Information
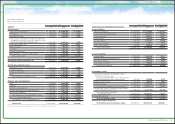
Consolidated Statements of Income
Toyota Motor Corporation
For the years ended March 31, 2009, 2010 and 2011
Yen in millions U.S. dollars in millions
2009 2010 2011 2011
Net revenues
Sales of products ¥19,173,720 ¥17,724,729 ¥17,820,520 $214,318
Financing operations 1,355,850 1,226,244 1,173,168 14,109
20,529,570 18,950,973 18,993,688 228,427
Costs and expenses
Cost of products sold 17,468,416 15,971,496 15,985,783 192,252
Cost of financing operations 987,384 712,301 629,543 7,571
Selling, general and administrative 2,534,781 2,119,660 1,910,083 22,972
20,990,581 18,803,457 18,525,409 222,795
Operating income (loss) (461,011) 147,516 468,279 5,632
Other income (expense)
Interest and dividend income 138,467 78,224 90,771 1,092
Interest expense (46,882) (33,409) (29,318) (353)
Foreign exchange gain (loss), net (1,815) 68,251 14,305 172
Other income (loss), net (189,140) 30,886 19,253 231
(99,370) 143,952 95,011 1,142
Income (loss) before income taxes and
equity in earnings of affiliated companies (560,381) 291,468 563,290 6,774
Provision for income taxes (56,442) 92,664 312,821 3,762
Equity in earnings of affiliated companies 42,724 45,408 215,016 2,586
Net income (loss) (461,215) 244,212 465,485 5,598
Less: Net (income) loss attributable to the noncontrolling interests 24,278 (34,756) (57,302) (689)
Net income (loss) attributable to Toyota Motor Corporation
¥ (436,937) ¥ 209,456 ¥ 408,183 $ 4,909
Yen U.S. dollars
Net income (loss) attributable to Toyota Motor Corporation per share
— Basic ¥ (139.13) ¥ 66.79 ¥ 130.17 $ 1.57
— Diluted ¥ (139.13) ¥ 66.79 ¥ 130.16 $ 1.57
Cash dividends per share ¥ 100.00 ¥ 45.00 ¥ 50.00 $ 0.60
The accompanying notes are an integral part of these consolidated financial statements.
71
TOYOTA ANNUAL REPORT 2011