Toyota 2011 Annual Report Download - page 88
Download and view the complete annual report
Please find page 88 of the 2011 Toyota annual report below. You can navigate through the pages in the report by either clicking on the pages listed below, or by using the keyword search tool below to find specific information within the annual report.-
 1
1 -
2
-
3
-
4
-
5
-
6
-
7
-
8
-
9
-
10
-
11
-
12
-
13
-
14
-
15
-
16
-
17
-
18
-
19
-
20
-
21
-
22
-
23
-
24
-
25
-
26
-
27
-
28
-
29
-
30
-
31
-
32
-
33
-
34
-
35
-
36
-
37
-
38
-
39
-
40
-
41
-
42
-
43
-
44
-
45
-
46
-
47
-
48
-
49
-
50
-
51
-
52
-
53
-
54
-
55
-
56
-
57
-
58
-
59
-
60
-
61
-
62
-
63
-
64
-
65
-
66
-
67
-
68
-
69
-
70
-
71
-
72
-
73
-
74
-
75
-
76
-
77
-
 78
78 -
 79
79 -
 80
80 -
 81
81 -
 82
82 -
 83
83 -
 84
84 -
 85
85 -
 86
86 -
 87
87 -
 88
88 -
 89
89 -
 90
90 -
 91
91 -
 92
92 -
 93
93 -
 94
94 -
 95
95 -
 96
96 -
 97
97 -
 98
98 -
99
-
100
-
101
-
102
-
103
-
104
-
105
-
106
-
107
-
108
-
109
-
110
-
111
-
112
-
113
 |
 |

0822
Financial Section and
Investor Information
Business and
Performance Review
Special FeatureMessage/Vision
Management and
Corporate Information
Notes to Consolidated Financial Statements
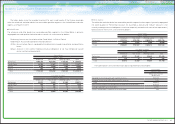
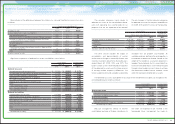
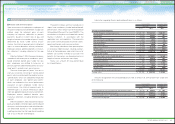
The valuation allowance mainly relates to
deferred tax assets of the consolidated subsid-
iaries with operating loss carryforwards for tax
purposes that are not expected to be realized.
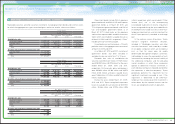
The net changes in the total valuation allowance
for deferred tax assets for the years ended March
31, 2009, 2010 and 2011 consist of the following:
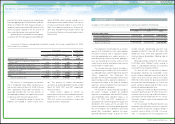
The other amount includes the impact of
consolidation and deconsolidation of certain
entities due to changes in ownership interest and
currency translation adjustments during the years
ended March 31, 2009, 2010 and 2011. The
factors used to assess the likelihood of realization
of the deferred tax assets are the future reversal
of existing taxable temporary differences, the
future taxable income and available tax planning
strategies that are prudent and feasible. All
available evidence, both positive and negative, is
considered to determine whether, based on the
weight of that evidence, a valuation allowance is
needed. Toyota believes that it is more likely than
not that the net deferred tax assets will be realized
through future taxable income. Failure to achieve
the forecasted taxable income, however, could
affect the realization of deferred tax assets.
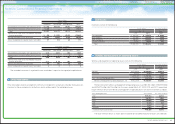
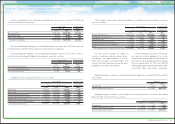
The deferred tax assets and liabilities that comprise the net deferred tax liability are included in the
consolidated balance sheets as follows:
Because management intends to reinvest
undistributed earnings of foreign subsidiaries to
the extent not expected to be remitted in the
foreseeable future, management has made no
Yen in millions
U.S. dollars in millions
For the years ended March 31,
For the year
ended March 31,
2009 2010 2011 2011
Valuation allowance at beginning of year ¥ 82,191 ¥208,627 ¥239,269 $2,877
Additions 145,707 46,704 55,791 671
Deductions (3,511) (14,066) (10,077) (121)
Other (15,760) (1,996) (4,298) (52)
Valuation allowance at end of year ¥208,627 ¥239,269 ¥280,685 $3,375
Yen in millions
U.S. dollars in millions
March 31, March 31,
2010 2011 2011
Deferred tax assets
Deferred income taxes (Current assets) ¥ 632,164 ¥ 605,884 $ 7,287
Investments and other assets - other 122,617 118,849 1,429
Deferred tax liabilities
Other current liabilities (9,338) (14,919) (179)
Deferred income taxes (Long-term liabilities) (813,221) (810,127) (9,743)
Net deferred tax liability ¥ (67,778) ¥(100,313) $(1,206)
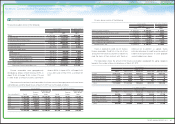
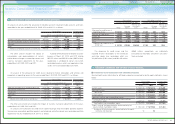
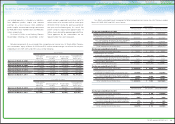
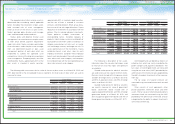
Significant components of deferred tax assets and liabilities are as follows:
Yen in millions
U.S. dollars in millions
March 31, March 31,
2010 2011 2011
Deferred tax assets
Accrued pension and severance costs ¥ 210,268 ¥ 226,093 $ 2,719
Accrued expenses and liabilities for quality assurances 277,696 395,513 4,757
Other accrued employees’ compensation 106,404 103,020 1,239
Operating loss carryforwards for tax purposes 146,114 296,731 3,568
Tax credit carryforwards 73,061 127,289 1,531
Property, plant and equipment and other assets 188,745 176,229 2,119
Other 474,380 277,449 3,337
Gross deferred tax assets 1,476,668 1,602,324 19,270
Less - Valuation allowance (239,269) (280,685) (3,375)
Total deferred tax assets ¥ 1,237,399 ¥ 1,321,639 $ 15,895
Deferred tax liabilities
Unrealized gains on securities (147,494) (146,874) (1,766)
Undistributed earnings of foreign subsidiaries (12,797) (26,783) (322)
Undistributed earnings of affiliates accounted for by the equity method
(575,929) (578,756) (6,961)
Basis difference of acquired assets (38,977) (38,351) (461)
Lease transactions (457,316) (537,174) (6,460)
Gain on securities contribution to employee retirement benefit trust
(66,523) (66,523) (800)
Other (6,141) (27,491) (331)
Gross deferred tax liabilities (1,305,177) (1,421,952) (17,101)
Net deferred tax liability ¥ (67,778) ¥ (100,313) $ (1,206)
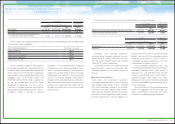
For the years ended March 31,
2009 2010 2011
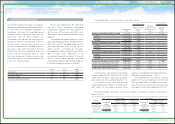
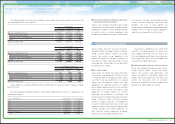
Statutory tax rate 40.2% 40.2% 40.2%
Increase (reduction) in taxes resulting from:
Non-deductible expenses (5.0) 1.9 2.2
Deferred tax liabilities on undistributed earnings of foreign subsidiaries
(2.5) 4.4 4.8
Deferred tax liabilities on undistributed earnings of affiliates
accounted for by the equity method (2.5) (0.6) 12.6
Valuation allowance (25.4) 11.2 8.1
Tax credits 10.0 (11.8) (2.6)
The difference between the statutory tax rate in Japan and that
of foreign subsidiaries 1.6 (12.9) (12.1)
Other (6.3) (0.6) 2.3
Effective income tax rate 10.1% 31.8%55.5%
Reconciliation of the differences between the statutory tax rate and the effective income tax rate is
as follows:
88
TOYOTA ANNUAL REPORT 2011