TCF Bank 2003 Annual Report Download - page 80
Download and view the complete annual report
Please find page 80 of the 2003 TCF Bank annual report below. You can navigate through the pages in the report by either clicking on the pages listed below, or by using the keyword search tool below to find specific information within the annual report.-
 1
1 -
2
-
3
-
4
-
5
-
6
-
7
-
8
-
9
-
10
-
11
-
12
-
13
-
14
-
15
-
16
-
17
-
18
-
19
-
20
-
21
-
22
-
23
-
24
-
25
-
26
-
27
-
28
-
29
-
30
-
31
-
32
-
33
-
34
-
35
-
36
-
37
-
38
-
39
-
40
-
41
-
42
-
43
-
44
-
45
-
46
-
47
-
48
-
49
-
50
-
51
-
52
-
53
-
54
-
55
-
56
-
57
-
58
-
59
-
60
-
61
-
62
-
63
-
64
-
65
-
66
-
67
-
68
-
69
-
 70
70 -
 71
71 -
 72
72 -
 73
73 -
 74
74 -
 75
75 -
 76
76 -
 77
77 -
 78
78 -
 79
79 -
 80
80 -
 81
81 -
 82
82 -
 83
83 -
 84
84 -
 85
85 -
 86
86
 |
 |

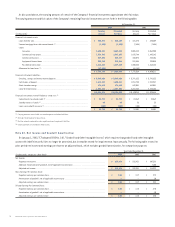
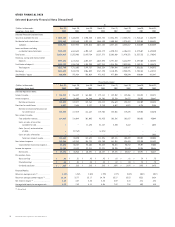
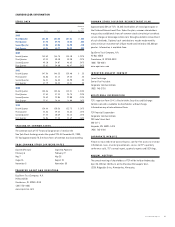
78 TCF Financial Corporation and Subsidiaries
OTHER FINANCIAL DATA
Selected Quarterly Financial Data (Unaudited)
At
(Dollars in thousands, Dec. 31, Sept. 30, June 30, March 31, Dec. 31, Sept. 30, June 30, March 31,
except per-share data) 2003 2003 2003 2003 2002 2002 2002 2002
Selected Financial Condition Data:
Securities available for sale . . . . . . . . . . . $ 1,533,288 $ 1,604,282 $ 1,980,830 $ 2,442,724 $ 2,426,794 $ 2,252,786 $ 1,965,664 $ 1,556,798
Residential real estate loans . . . . . . . . . . . 1,212,643 1,283,640 1,393,183 1,568,430 1,800,344 1,975,481 2,249,365 2,458,431
Subtotal . . . . . . . . . . . . . . . . . . . . . . . 2,745,931 2,887,922 3,374,013 4,011,154 4,227,138 4,228,267 4,215,029 4,015,229
Loans and leases excluding
residential real estate loans . . . . . . . 7,135,135 6,863,683 6,705,169 6,485,179 6,320,784 6,106,818 5,879,607 5,693,330
Total assets . . . . . . . . . . . . . . . . . . . . . . . . 11,319,015 11,253,906 11,807,764 12,127,272 12,202,069 11,970,331 11,527,351 11,170,583
Checking, savings and money market
deposits . . . . . . . . . . . . . . . . . . . . . . . 5,999,626 6,115,863 6,234,447 6,068,095 5,791,233 5,636,989 5,397,505 5,108,494
Certificates of deposit . . . . . . . . . . . . . . . . 1,612,123 1,596,740 1,745,290 1,897,243 1,918,755 2,023,508 2,159,121 2,185,478
Total deposits . . . . . . . . . . . . . . . . . . . 7,611,749 7,712,603 7,979,737 7,965,338 7,709,988 7,660,497 7,556,626 7,293,972
Borrowings . . . . . . . . . . . . . . . . . . . . . . . . . 2,414,825 2,243,725 2,506,039 2,767,890 3,110,295 2,955,295 2,702,133 2,610,712
Stockholders’ equity . . . . . . . . . . . . . . . . . 920,858 931,968 952,069 971,413 977,020 950,290 920,088 921,847
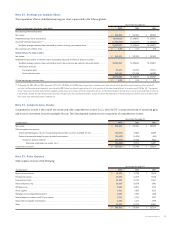
Three Months Ended
(Dollars in thousands, Dec. 31, Sept. 30, June 30, March 31, Dec. 31, Sept. 30, June 30, March 31,
except per-share data) 2003 2003 2003 2003 2002 2002 2002 2002
Selected Operations Data:
Interest income . . . . . . . . . . . . . . . . . . . . . $ 148,919 $ 156,482 $ 164,004 $ 172,114 $ 182,352 $ 182,406 $ 184,234 $ 184,371
Interest expense . . . . . . . . . . . . . . . . . . . . 29,827 36,605 44,240 49,702 55,729 58,637 59,925 59,847
Net interest income . . . . . . . . . . . . . . 119,092 119,877 119,764 122,412 126,623 123,769 124,309 124,524
Provision for credit losses . . . . . . . . . . . . . 4,037 2,658 3,127 2,710 4,067 4,071 4,714 9,154
Net interest income after provision
for credit losses . . . . . . . . . . . . . . 115,055 117,219 116,637 119,702 122,556 119,698 119,595 115,370
Non-interest income:
Fees and other revenue . . . . . . . . . . . . 114,865 118,089 101,003 96,835 106,346 102,837 102,032 95,049
Gains on sales of securities
available for sale . . . . . . . . . . . . . –– 11,695 21,137 2,830 2,662 – 6,044
Gains (losses) on termination
of debt . . . . . . . . . . . . . . . . . . . . . –(37,769) – (6,576) – – – –
Gains on sales of branches . . . . . . . . . –– – ––––1,962
Total non-interest income . . . . . . 114,865 80,320 112,698 111,396 109,176 105,499 102,032 103,055
Non-interest expense . . . . . . . . . . . . . . . . 142,244 142,382 136,733 138,750 141,251 134,485 132,130 131,422
Income before income tax expense . . . 87,676 55,157 92,602 92,348 90,481 90,712 89,497 87,003
Income tax expense . . . . . . . . . . . . . . . . . . 28,180 19,193 32,311 32,221 30,705 31,845 31,526 30,686
Net income . . . . . . . . . . . . . . . . . . . . . $ 59,496 $ 35,964 $ 60,291 $ 60,127 $ 59,776 $ 58,867 $ 57,971 $ 56,317
Per common share:
Basic earnings . . . . . . . . . . . . . . . . . . . $ .86 $ .51 $ .85 $ .83 $ .83 $ .81 $ .78 $ .75
Diluted earnings . . . . . . . . . . . . . . . . . $ .86 $ .51 $ .85 $ .83 $ .82 $ .80 $ .78 $ .75
Dividends declared . . . . . . . . . . . . . . . $ .325 $ .325 $ .325 $ .325 $ .2875 $ .2875 $ .2875 $ .2875
Financial Ratios:
Return on average assets (1) . . . . . . . . . . . . 2.13% 1.24% 2.04% 1.99% 1.97% 2.03% 2.04% 2.01%
Return on average common equity (1) . . . . . 26.18 15.77 25.17 24.70 25.17 25.53 25.36 24.68
Net interest margin (1) . . . . . . . . . . . . . . . . . . 4.68 4.57 4.45 4.45 4.59 4.68 4.76 4.83
Average total equity to average assets . . . 8.13 7.89 8.11 8.06 7.82 7.96 8.03 8.15
(1) Annualized.