TCF Bank 2003 Annual Report Download - page 35
Download and view the complete annual report
Please find page 35 of the 2003 TCF Bank annual report below. You can navigate through the pages in the report by either clicking on the pages listed below, or by using the keyword search tool below to find specific information within the annual report.-
 1
1 -
2
-
3
-
4
-
5
-
6
-
7
-
8
-
9
-
10
-
11
-
12
-
13
-
14
-
15
-
16
-
17
-
18
-
19
-
20
-
21
-
22
-
23
-
24
-
 25
25 -
 26
26 -
 27
27 -
 28
28 -
 29
29 -
 30
30 -
 31
31 -
 32
32 -
 33
33 -
 34
34 -
 35
35 -
 36
36 -
 37
37 -
 38
38 -
 39
39 -
 40
40 -
 41
41 -
 42
42 -
 43
43 -
 44
44 -
 45
45 -
46
-
47
-
48
-
49
-
50
-
51
-
52
-
53
-
54
-
55
-
56
-
57
-
58
-
59
-
60
-
61
-
62
-
63
-
64
-
65
-
66
-
67
-
68
-
69
-
70
-
71
-
72
-
73
-
74
-
75
-
76
-
77
-
78
-
79
-
80
-
81
-
82
-
83
-
84
-
85
-
86
 |
 |

2003 Annual Report 33
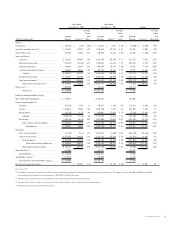
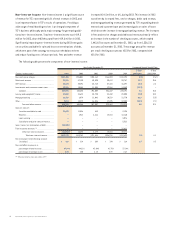
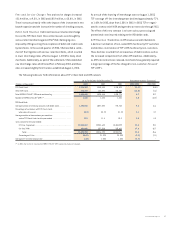
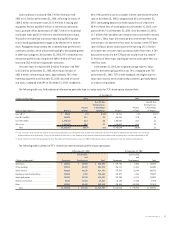
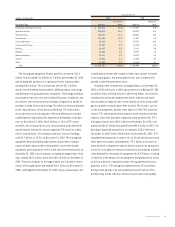
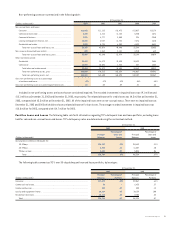
The following table sets forth additional information about the loan-to-value ratios for TCF’s home equity loan portfolio:
At December 31,
(Dollars in thousands) 2003 2002
Over 30-Day Over 30-Day
Delinquency as Delinquency as
Percent a Percentage Percent a Percentage
Loan-to-Value Ratios(1) Balance of Total of Balance Balance of Total of Balance
Over 100%(2) . . . . . . . . . . . . . . . . . . . . . . . . . . . . . $ 39,452 1.1% 4.81% $ 53,916 1.8% 2.17%
Over 90% to 100% . . . . . . . . . . . . . . . . . . . . . . . 361,374 10.1 .78 384,988 13.0 .80
Over 80% to 90% . . . . . . . . . . . . . . . . . . . . . . . . 1,370,523 38.2 .40 1,028,207 34.8 .62
80% or less . . . . . . . . . . . . . . . . . . . . . . . . . . . . . 1,816,678 50.6 .39 1,488,533 50.4 .52
Total . . . . . . . . . . . . . . . . . . . . . . . . . . . . . . . $3,588,027 100.0% .48% $2,955,644 100.0% .62
(1) Loan-to-value is based on the loan amount (current outstanding balance on closed-end loans and the total commitment on lines of credit) plus deferred loan origination costs net of fees
and refundable insurance premiums, if any, plus the amount of senior liens, if any. Property values represent the most recent market value or property tax assessment value known to TCF.
(2) Amount reflects the total outstanding loan balance. The portion of the loan balance in excess of 100% of the property value is substantially less than the amount included above.
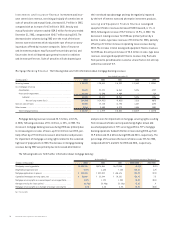
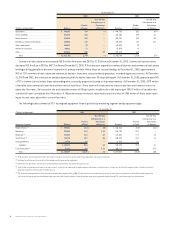
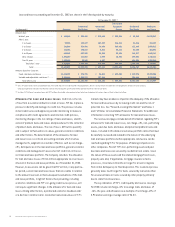
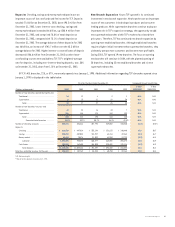
The following tables summarize TCF’s commercial real estate loan portfolio by property type:
At December 31, 2003 At December 31, 2002
Construction Construction
and and
(Dollars in thousands) Permanent Development Total Permanent Development Total
Apartments . . . . . . . . . . . . . . . . . . . . . . . . . . . . $ 519,622 $ 28,983 $ 548,605 $ 479,703 $ 5,052 $ 484,755
Office buildings . . . . . . . . . . . . . . . . . . . . . . . . 399,112 33,262 432,374 356,814 11,588 368,402
Retail services . . . . . . . . . . . . . . . . . . . . . . . . . . . 304,295 10,139 314,434 279,587 23,149 302,736
Warehouse/industrial buildings . . . . . . . . . . . . 189,635 1,253 190,888 184,073 1,456 185,529
Hotels and motels . . . . . . . . . . . . . . . . . . . . . . . . . 131,367 19,270 150,637 107,905 41,118 149,023
Health care facilities . . . . . . . . . . . . . . . . . . . . . 32,157 17,664 49,821 36,250 11,220 47,470
Other . . . . . . . . . . . . . . . . . . . . . . . . . . . . . . . . . . 169,247 60,695 229,942 195,528 102,345 297,873
Total . . . . . . . . . . . . . . . . . . . . . . . . . . . . . . . $1,745,435 $ 171,266 $1,916,701 $1,639,860 $ 195,928 $1,835,788
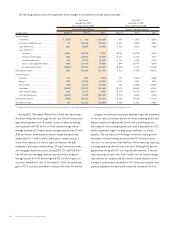
Loans and leases increased $226.7 million from year-end
2002 to $8.3 billion at December 31,2003, reflecting increases of
$624.5 million in consumer loans, $121.4 million in leasing and
equipment finance and $80.9 million in commercial real estate
loans, partially offset by decreases of $587.7 million in residential
real estate loans and $12.4 million in commercial business loans.
The decline in residential real estate loans during 2003 was due
to accelerating prepayments brought on by the decline in interest
rates. Management expects that the residential loan portfolio will
continue to decline, which will provide funding for anticipated growth
in other loan categories. At December 31, 2003, TCF’s residential real
estate loan portfolio was comprised of $894.3 million of fixed-rate
loans and $312.4 million of adjustable-rate loans.
Consumer loans increased $624.5 million from year-end 2002
to $3.6 billion at December 31, 2003, driven by an increase of
$632.4 million in home equity loans. Approximately 70% of the
home equity portfolio at December 31, 2003 consisted of closed-
end loans, compared with 69% at December 31, 2002. In addition,
60% of this portfolio carries a variable interest rate tied to the prime
rate, at December 31, 2003, compared with 62% at December 31,
2002. Outstanding balances on home equity lines of credit were
45.4% of total lines of credit balances at December 31, 2003, com-
pared with 45.7% at December 31, 2002. As of December 31, 2003,
$1.7 billion of the variable rate consumer loans were at their interest
rate floors. These loans will remain at their interest rate floor until
interest rates rise above the floor rates. An increase in the TCF base
rate of 50 basis points would result in the repricing of $1.2 billion
of variable rate consumer loans currently at their floor rates. A 100
basis point increase in the TCF base rate would result in a total of
$1.4 billion of these loans repricing at interest rates above their cur-
rent floor rates.
At December 31, 2003, the weighted average loan-to-value
ratio for the home equity portfolio was 74%, compared with 72%
at December 31, 2002. TCF’s credit standards limit higher loan-to-
value ratio loans to more creditworthy customers, generally based
on credit scoring models.