TCF Bank 2003 Annual Report Download - page 23
Download and view the complete annual report
Please find page 23 of the 2003 TCF Bank annual report below. You can navigate through the pages in the report by either clicking on the pages listed below, or by using the keyword search tool below to find specific information within the annual report.-
 1
1 -
2
-
3
-
4
-
5
-
6
-
7
-
8
-
9
-
10
-
11
-
12
-
 13
13 -
 14
14 -
 15
15 -
 16
16 -
 17
17 -
 18
18 -
 19
19 -
 20
20 -
 21
21 -
 22
22 -
 23
23 -
 24
24 -
 25
25 -
 26
26 -
 27
27 -
 28
28 -
 29
29 -
 30
30 -
 31
31 -
 32
32 -
 33
33 -
34
-
35
-
36
-
37
-
38
-
39
-
40
-
41
-
42
-
43
-
44
-
45
-
46
-
47
-
48
-
49
-
50
-
51
-
52
-
53
-
54
-
55
-
56
-
57
-
58
-
59
-
60
-
61
-
62
-
63
-
64
-
65
-
66
-
67
-
68
-
69
-
70
-
71
-
72
-
73
-
74
-
75
-
76
-
77
-
78
-
79
-
80
-
81
-
82
-
83
-
84
-
85
-
86
 |
 |

2003 Annual Report 21
per common share, compared with a $2.1 million after-tax gain on
sale of a branch, or 3 cents per common share in 2001. There were no
branch sales in 2003. In 2002, new accounting rules under generally
accepted accounting principles (“GAAP”) eliminated the amortiza-
tion of goodwill. Goodwill amortization reduced net income by $7.6
million, or 10 cents per diluted common share in 2001.
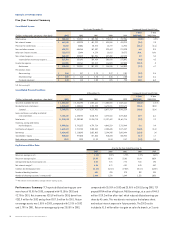
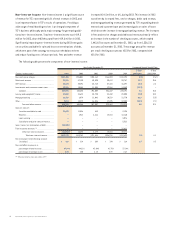
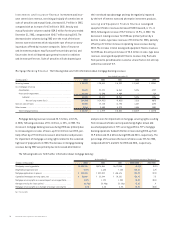
Operating Segment Results BANKING, comprised of deposits
and investment products, commercial banking, small business
banking, consumer lending, residential lending and treasury services,
reported net income of $181 million for 2003, down 10% from $201.1
million in 2002. Banking net interest income for 2003 was $414.3 mil-
lion, compared with $435.9 million for 2002. The provision for credit
losses totaled $4.4 million in 2003, down from $12.8 million in 2002,
driven by decreases in net charge-offs in the commercial business,
commercial real estate, and consumer loan portfolios. Non-interest
income totaled $355.4 million, down 1.3% from $359.9 million in
2002. During 2003, TCF prepaid $954 million of FHLB advances and
recorded losses on terminations of debt totaling $44.3 million. There
were no similar debt terminations during 2002. During 2003, TCF sold
mortgage-backed securities and realized gains of $32.8 million, com-
pared with similar gains of $11.5 million for 2002. See “Consolidated
Income Statement Analysis – Consolidated Net Interest Income” for
further discussion on debt terminations and on the sales of mortgage-
backed securities during 2003. In addition to the gains and losses
discussed above, fees, service charges, debit card and other
revenues were $366.9 million for 2003, up $20.5 million, or 5.9%,
from 2002. These increases resulted from TCF’s expanding branch
network and customer base, and increased utilization of debit cards
by customers. Non-interest expense totaled $487.8 million, up 3.4%
from $471.7 million in 2002. The increase was primarily due to addi-
tional advertising and promotion expense focused on the production
and retention of TCF’s deposit customer base, costs associated with
new branch expansion and the write-off of $1.2 million of leasehold
improvements related to 12 closed supermarket branches.
TCF had 401 branches, including 237 full service branches in
supermarkets at December 31, 2003. During 2003, TCF opened 19
new branches, of which five were supermarket branches. TCF remains
focused on a long-term strategy of expanding its franchise with the
planned opening of 28 new branches in 2004, consisting of 22 new
traditional branches and six new supermarket branches.
LEASING AND EQUIPMENT FINANCE, an operating segment
comprised of TCF’s wholly-owned subsidiaries Winthrop and TCF
Leasing, provides a broad range of comprehensive lease and equip-
ment finance products. This operating segment reported net income
of $29.3 million for 2003, up 6.5% from $27.5 million in 2002. Net
interest income for 2003 was $45.4 million, up 9.6% from $41.4 mil-
lion in 2002. The provision for credit losses for this operating segment
totaled $8.2 million in 2003, down from $9.2 million in 2002, primarily
as a result of a decrease in non-accrual loans and leases. Non-
interest income totaled $51.1 million in 2003, down $718 thousand
from $51.8 million in 2002. Leasing and Equipment Finance revenues
may fluctuate from period to period based on customer driven factors
not entirely within the control of TCF. Non-interest expense totaled
$42 million in 2003, up $994 thousand from $41 million in 2002.
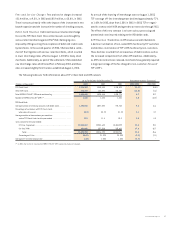
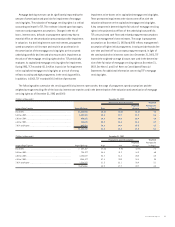
MORTGAGE BANKING activities include the origination of residen-
tial mortgage loans, generally for sale to third parties with servicing
retained. This operating segment reported net income of $2.9 million
for 2003, compared with $2.7 million for 2002. TCF’s mortgage bank-
ing operations funded $3 billion in loans during 2003, up from $2.9
billion in 2002, primarily reflecting continued high levels of refinance
activity. In 2003, 74% of total mortgage banking loan originations
were refinancings, up from 67% in 2002. Non-interest income totaled
$13.1 million, up 57.6% from $8.3 million in 2002. The increase in
non-interest income was primarily due to increased gains on sales
of loans over 2002, which was partially offset by increased amorti-
zation and provision for impairment of mortgage servicing rights
related to the sustained high level of prepayments. The increase
in gains on sales of loans was primarily due to the increase in retail
loan originations as a percentage of total loan originations from
37% in 2002 to 45% in 2003 and the improved pricing on retail and
wholesale loan originations during the refinance boom. Mortgage
applications in process (mortgage pipeline) declined to $241.1 mil-
lion at December 31, 2003 from $532 million at December 31, 2002
as refinance activity slowed during the latter part of 2003.The annu-
alized prepayment rate on the third party servicing portfolio was
22% for the fourth quarter of 2003, down from 67% for the fourth
quarter of 2002, and 71% for the third quarter of 2003. Mortgage
Banking’s non-interest expense totaled $30 million for 2003, up
20.8% from $24.8 million for 2002. Contributing to the increase in
non-interest expense during 2003 were increased expenses resulting
from higher levels of production and prepayment activity.
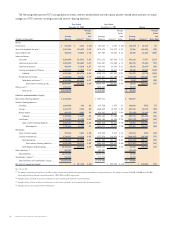
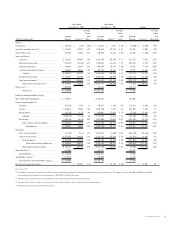
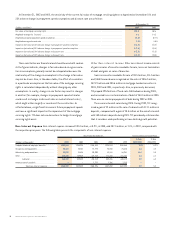
CONSOLIDATED INCOME STATEMENT ANALYSIS
Net Interest Income Net interest income, which is the
difference between interest earned on loans and leases, securities
available for sale, investments and other interest-earning assets
(interest income), and interest paid on deposits and borrowings
(interest expense), represented 53.4% of TCF’s revenue in 2003.
Net interest income divided by average interest-earning assets is
referred to as the net interest margin, expressed as a percentage.
Net interest income and net interest margin are affected by changes
in interest rates, and by loan and deposit pricing strategies and
competitive conditions, the volume and the mix of interest-earning
assets and interest-bearing liabilities, and the level of non-
performing assets.