TCF Bank 2003 Annual Report Download - page 24
Download and view the complete annual report
Please find page 24 of the 2003 TCF Bank annual report below. You can navigate through the pages in the report by either clicking on the pages listed below, or by using the keyword search tool below to find specific information within the annual report.-
 1
1 -
2
-
3
-
4
-
5
-
6
-
7
-
8
-
9
-
10
-
11
-
12
-
13
-
 14
14 -
 15
15 -
 16
16 -
 17
17 -
 18
18 -
 19
19 -
 20
20 -
 21
21 -
 22
22 -
 23
23 -
 24
24 -
 25
25 -
 26
26 -
 27
27 -
 28
28 -
 29
29 -
 30
30 -
 31
31 -
 32
32 -
 33
33 -
 34
34 -
35
-
36
-
37
-
38
-
39
-
40
-
41
-
42
-
43
-
44
-
45
-
46
-
47
-
48
-
49
-
50
-
51
-
52
-
53
-
54
-
55
-
56
-
57
-
58
-
59
-
60
-
61
-
62
-
63
-
64
-
65
-
66
-
67
-
68
-
69
-
70
-
71
-
72
-
73
-
74
-
75
-
76
-
77
-
78
-
79
-
80
-
81
-
82
-
83
-
84
-
85
-
86
 |
 |

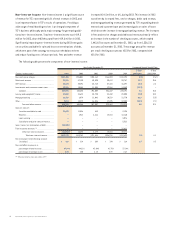
22 TCF Financial Corporation and Subsidiaries
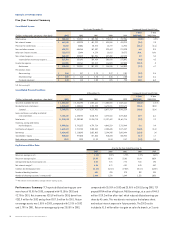
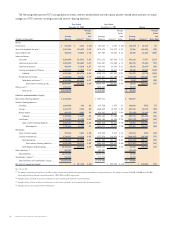
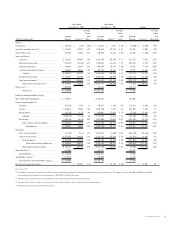
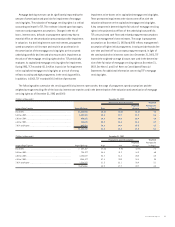
The following tables present TCF’s average balance sheets, interest and dividends earned or paid, and the related yields and rates on major
categories of TCF’s interest-earning assets and interest-bearing liabilities:
Year Ended Year Ended
December 31, 2003 December 31, 2002 Change
Average Average Average
Yields Yields Yields
Average and Average and Average and
(Dollars in thousands) Balance Interest(1) Rates Balance Interest(1) Rates Balance Interest(1) Rates (bps)
Assets:
Investments . . . . . . . . . . . . . . . . . . . . . . . . . . . . . . $ 101,455 $ 4,511 4.45% $ 154,862 $ 6,934 4.48% $ (53,407) $ (2,423) (3)
Securities available for sale (2) . . . . . . . . . . . . . . . . 1,891,062 103,821 5.49 1,879,674 118,272 6.29 11,388 (14,451) (80)
Loans held for sale . . . . . . . . . . . . . . . . . . . . . . . . . 488,634 20,016 4.10 437,702 22,464 5.13 50,932 (2,448) (103)
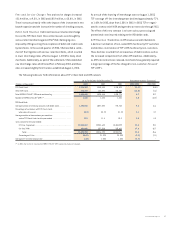
Loans and leases:
Consumer . . . . . . . . . . . . . . . . . . . . . . . . . . . . 3,288,040 214,971 6.54 2,712,812 207,492 7.65 575,228 7,479 (111)
Commercial real estate . . . . . . . . . . . . . . . . . . 1,854,452 108,867 5.87 1,746,207 118,355 6.78 108,245 (9,488) (91)
Commercial business . . . . . . . . . . . . . . . . . . . 445,634 19,020 4.27 435,488 22,699 5.21 10,146 (3,679) (94)
Leasing and equipment finance . . . . . . . . . . . 1,094,532 81,912 7.48 995,672 85,447 8.58 98,860 (3,535) (110)
Subtotal . . . . . . . . . . . . . . . . . . . . . . . . . . 6,682,658 424,770 6.36 5,890,179 433,993 7.37 792,479 (9,223) (101)
Residential real estate . . . . . . . . . . . . . . . . . . 1,440,688 88,401 6.14 2,227,537 151,700 6.81 (786,849) (63,299) (67)
Total loans and leases (3) . . . . . . . . . . . . . . 8,123,346 513,171 6.32 8,117,716 585,693 7.21 5,630 (72,522) (89)
Total interest-earning assets . . . . . . . 10,604,497 641,519 6.05 10,589,954 733,363 6.92 14,543 (91,844) (87)
Other assets (4) . . . . . . . . . . . . . . . . . . . . . . . . . . . . 1,053,073 1,020,550 32,523
Total assets . . . . . . . . . . . . . . . . . . . . . . . $11,657,570 $11,610,504 $ 47,066
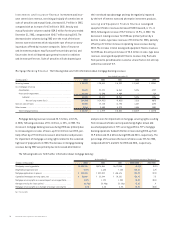
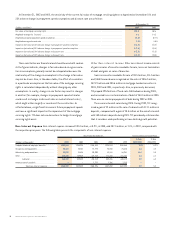
Liabilities and Stockholders’ Equity:
Non-interest bearing deposits . . . . . . . . . . . . . . . . . $ 2,232,883 $ 1,893,916 $ 338,967
Interest-bearing deposits:
Checking . . . . . . . . . . . . . . . . . . . . . . . . . . . . . . . 1,064,380 948 .09 915,720 1,479 .16 148,660 (531) (7)
Savings . . . . . . . . . . . . . . . . . . . . . . . . . . . . . . . 1,847,775 9,298 .50 1,560,539 15,924 1.02 287,236 (6,626) (52)
Money market . . . . . . . . . . . . . . . . . . . . . . . . . . . . 887,273 4,447 .50 919,393 9,737 1.06 (32,120) (5,290) (56)
Subtotal . . . . . . . . . . . . . . . . . . . . . . . . . . 3,799,428 14,693 .39 3,395,652 27,140 .80 403,776 (12,447) (41)
Certificates . . . . . . . . . . . . . . . . . . . . . . . . . . . 1,743,533 42,102 2.41 2,108,708 68,246 3.24 (365,175) (26,144) (83)
Total interest-bearing deposits . . . . . . . . 5,542,961 56,795 1.02 5,504,360 95,386 1.73 38,601 (38,591) (71)
Total deposits . . . . . . . . . . . . . . . . . . 7,775,844 56,795 .73 7,398,276 95,386 1.29 377,568 (38,591) (56)
Borrowings:
Short-term borrowings . . . . . . . . . . . . . . . . . . 757,128 9,451 1.25 573,935 9,874 1.72 183,193 (423) (47)
Long-term borrowings . . . . . . . . . . . . . . . . . . . 1,778,671 94,128 5.29 2,277,974 128,878 5.66 (499,303) (34,750) (37)
Total borrowings . . . . . . . . . . . . . . . . . . . . 2,535,799 103,579 4.08 2,851,909 138,752 4.87 (316,110) (35,173) (79)
Total interest-bearing liabilities . . . . 8,078,760 160,374 1.99 8,356,269 234,138 2.80 (277,509) (73,764) (81)
Total deposits and borrowings . . . . . . . . . 10,311,643 160,374 1.56 10,250,185 234,138 2.28 61,458 (73,764) (72)
Other liabilities(4) . . . . . . . . . . . . . . . . . . . . . . . . . . 409,539 442,404 (32,865)
Total liabilities . . . . . . . . . . . . . . . . . . . . . . . . 10,721,182 10,692,589 28,593
Stockholders’ equity (4)
. . . . . . . . . . . . . . . . . . . . . . 936,388 917,915 18,473
Total liabilities and stockholders’ equity . . . . . $11,657,570 $11,610,504 $ 47,066
Net interest income and margin . . . . . . . . . . . . . . . $ 481,145 4.54% $ 499,225 4.71% $ (18,080) (17)
bps = basis points
(1) Tax-exempt income was not significant and thus interest income and related yields have not been presented on a tax equivalent basis. Tax-exempt income of $523,000, $354,000 and $156,000
was recognized during the years ended December 31, 2003, 2002 and 2001, respectively.
(2) Average balance and yield of securities available for sale are based upon the historical amortized cost.
(3) Average balance of loans and leases includes non-accrual loans and leases, and is presented net of unearned income.
(4) Average balance is based upon month-end balances.