TCF Bank 2003 Annual Report Download - page 28
Download and view the complete annual report
Please find page 28 of the 2003 TCF Bank annual report below. You can navigate through the pages in the report by either clicking on the pages listed below, or by using the keyword search tool below to find specific information within the annual report.-
 1
1 -
2
-
3
-
4
-
5
-
6
-
7
-
8
-
9
-
10
-
11
-
12
-
13
-
14
-
15
-
16
-
17
-
 18
18 -
 19
19 -
 20
20 -
 21
21 -
 22
22 -
 23
23 -
 24
24 -
 25
25 -
 26
26 -
 27
27 -
 28
28 -
 29
29 -
 30
30 -
 31
31 -
 32
32 -
 33
33 -
 34
34 -
 35
35 -
 36
36 -
 37
37 -
 38
38 -
39
-
40
-
41
-
42
-
43
-
44
-
45
-
46
-
47
-
48
-
49
-
50
-
51
-
52
-
53
-
54
-
55
-
56
-
57
-
58
-
59
-
60
-
61
-
62
-
63
-
64
-
65
-
66
-
67
-
68
-
69
-
70
-
71
-
72
-
73
-
74
-
75
-
76
-
77
-
78
-
79
-
80
-
81
-
82
-
83
-
84
-
85
-
86
 |
 |

26 TCF Financial Corporation and Subsidiaries
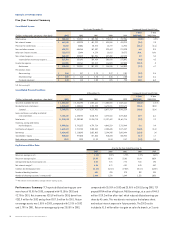
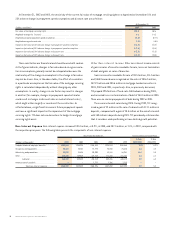
Non-Interest Income Non-interest income is a significant source
of revenue for TCF, representing 46.6% of total revenues in 2003, and
is an important factor in TCF’s results of operations. Providing a
wide range of retail banking services is an integral component of
TCF’s business philosophy and a major strategy for generating addi-
tional non-interest income. Total non-interest income was $419.3
million for 2003, down $483 thousand from $419.8 million in 2002.
Significantly impacting non-interest income during 2003 were gains
on securities available for sale and losses on terminations of debt,
which were part of the strategy to restructure the balance sheet
and reduce funding costs in future periods. Fees and other revenue
increased $24.5 million, or 6%, during 2003. This increase in 2003
was driven by increased fees, service charges, debit card revenue,
and mortgage banking revenue generated by TCF’s expanding branch
network and customer base and increased gains on sales of loans
which drove the increase in mortgage banking revenue. The increases
in fees and service charges and debit card revenue primarily reflect
an increase in the number of checking accounts, which totaled
1,443,821 accounts at December 31, 2003, up from 1,338,313
accounts at December 31, 2002. The average annual fee revenue
per retail checking account was $223 for 2003, compared with
$218 for 2002.
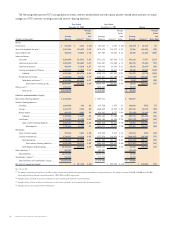
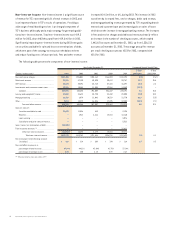
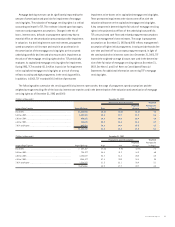
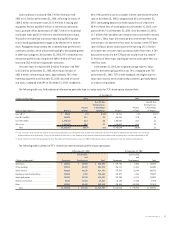
The following table presents the components of non-interest income:
Year Ended December 31, Compound Annual Growth Rate
1-Year 5-Year
(Dollars in thousands) 2003 2002 2001 2000 1999 2003/2002 2003/1998
Fees and service charges . . . . . . . . . . . . . . . . . . $247,456 $226,051 $195,162 $166,394 $138,198 9.5% 17.6%
Debit card revenue . . . . . . . . . . . . . . . . . . . . . . 52,991 47,190 40,525 30,613 20,747 12.3 35.4
ATM revenue . . . . . . . . . . . . . . . . . . . . . . . . . . . . . . 43,623 45,296 45,768 47,334 46,397 (3.7) 2.3
Investments and insurance commissions . . . . . . 13,901 15,848 11,554 12,266 14,849 (12.3) –
Subtotal . . . . . . . . . . . . . . . . . . . . . . . . . . . . . 357,971 334,385 293,009 256,607 220,191 7.1 15.5
Leasing and equipment finance . . . . . . . . . . . . . 51,088 51,628 45,730 38,442 28,505 (1.0) 10.3
Mortgage banking . . . . . . . . . . . . . . . . . . . . . . . . 12,719 6,979 12,042 10,519 12,770 82.2 (5.5)
Other . . . . . . . . . . . . . . . . . . . . . . . . . . . . . . . . . 9,014 13,272 16,526 17,895 12,854 (32.1) (7.1)
Fees and other revenue . . . . . . . . . . . . . 430,792 406,264 367,307 323,463 274,320 6.0 12.8
Gains on sales of:
Securities available for sale . . . . . . . . . . . . 32,832 11,536 863 – 3,194
Branches . . . . . . . . . . . . . . . . . . . . . . . . . . . – 1,962 3,316 12,813 12,160
Loan servicing . . . . . . . . . . . . . . . . . . . . . . . – – – – 3,076
Subsidiaries and joint venture interest . . . . –– – – 5,522
Gains (losses) on termination of debt . . . . . . . . (44,345) – – – –
Title insurance revenues (1) . . . . . . . . . . . . . . . . . – – – – 15,421
Other non-interest income . . . . . . . . . . (11,513) 13,498 4,179 12,813 39,373
Total non-interest income . . . . . . . $419,279 $419,762 $371,486 $336,276 $313,693 (.1) 8.1
Fee revenue per retail checking account
(in dollars) . . . . . . . . . . . . . . . . . . . . . . . . . $ 223 $ 218 $ 209 $ 190 $ 168 2.3 9.3
Fees and other revenue as a:
percentage of total revenue . . . . . . . . . . . . 47.84% 44.21% 43.08% 41.75% 37.18%
percentage of average assets . . . . . . . . . . . 3.70 3.50 3.18 2.98 2.67
(1) Title insurance business was sold in 1999.