TCF Bank 2003 Annual Report Download - page 54
Download and view the complete annual report
Please find page 54 of the 2003 TCF Bank annual report below. You can navigate through the pages in the report by either clicking on the pages listed below, or by using the keyword search tool below to find specific information within the annual report.-
 1
1 -
2
-
3
-
4
-
5
-
6
-
7
-
8
-
9
-
10
-
11
-
12
-
13
-
14
-
15
-
16
-
17
-
18
-
19
-
20
-
21
-
22
-
23
-
24
-
25
-
26
-
27
-
28
-
29
-
30
-
31
-
32
-
33
-
34
-
35
-
36
-
37
-
38
-
39
-
40
-
41
-
42
-
43
-
 44
44 -
 45
45 -
 46
46 -
 47
47 -
 48
48 -
 49
49 -
 50
50 -
 51
51 -
 52
52 -
 53
53 -
 54
54 -
 55
55 -
 56
56 -
 57
57 -
 58
58 -
 59
59 -
 60
60 -
 61
61 -
 62
62 -
 63
63 -
 64
64 -
65
-
66
-
67
-
68
-
69
-
70
-
71
-
72
-
73
-
74
-
75
-
76
-
77
-
78
-
79
-
80
-
81
-
82
-
83
-
84
-
85
-
86
 |
 |

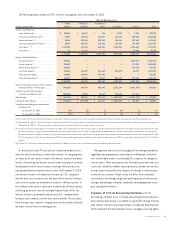
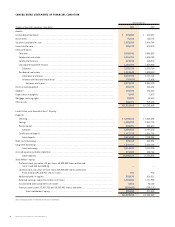
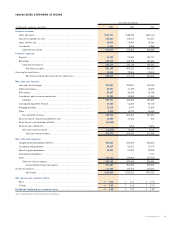
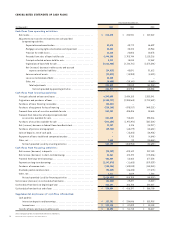
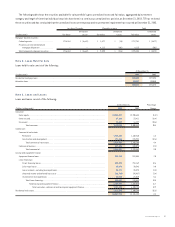
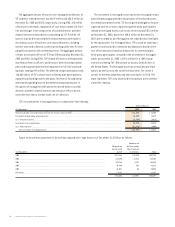
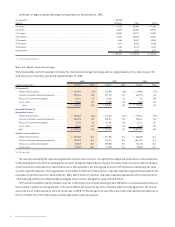
52 TCF Financial Corporation and Subsidiaries
CONSOLIDATED STATEMENTS OF CASH FLOWS
Year Ended December 31,
(In thousands) 2003 2002 2001
Cash flows from operating activities:
Net income . . . . . . . . . . . . . . . . . . . . . . . . . . . . . . . . . . . . . . . . . . . . . . . . . . . . . $ 215,878 $ 232,931 $ 207,322
Adjustments to reconcile net income to net cash provided
by operating activities:
Depreciation and amortization . . . . . . . . . . . . . . . . . . . . . . . . . . . . . . . . 39,478 40,772 46,599
Mortgage servicing rights amortization and impairment . . . . . . . . . . . . . 44,833 35,374 20,964
Provision for credit losses . . . . . . . . . . . . . . . . . . . . . . . . . . . . . . . . . . . . 12,532 22,006 20,878
Proceeds from sales of loans held for sale . . . . . . . . . . . . . . . . . . . . . . . . 2,944,298 2,703,744 2,135,218
Principal collected on loans held for sale . . . . . . . . . . . . . . . . . . . . . . . . 8,913 15,814 12,469
Originations of loans held for sale . . . . . . . . . . . . . . . . . . . . . . . . . . . . . . . (2,816,960) (2,734,741) (2,375,396)
Net (increase) decrease in other assets and accrued
expenses and other liabilities . . . . . . . . . . . . . . . . . . . . . . . . . . . . . . (14,913) 43,091 91,612
Gains on sales of assets . . . . . . . . . . . . . . . . . . . . . . . . . . . . . . . . . . . . . . (32,832) (13,900) (4,393)
Losses on termination of debt . . . . . . . . . . . . . . . . . . . . . . . . . . . . . . . . . 44,345 ––
Other, net . . . . . . . . . . . . . . . . . . . . . . . . . . . . . . . . . . . . . . . . . . . . . . . . (8,655) (20,141) (9,885)
Total adjustments . . . . . . . . . . . . . . . . . . . . . . . . . . . . . . . . . . . . . . . 221,039 92,019 (61,934)
Net cash provided by operating activities . . . . . . . . . . . . . . . . . . . 436,917 324,950 145,388
Cash flows from investing activities:
Principal collected on loans and leases . . . . . . . . . . . . . . . . . . . . . . . . . . . . . . . 4,343,655 3,434,153 3,352,341
Originations and purchases of loans . . . . . . . . . . . . . . . . . . . . . . . . . . . . . . . . . . (4,108,727) (2,984,568) (2,719,682)
Purchases of lease financing receivables . . . . . . . . . . . . . . . . . . . . . . . . . . . . . . (58,421) – –
Purchases of equipment for lease financing . . . . . . . . . . . . . . . . . . . . . . . . . . . . (510,140) (470,917) (449,231)
Proceeds from sales of securities available for sale . . . . . . . . . . . . . . . . . . . . . . 849,333 485,406 33,645
Proceeds from maturities of and principal collected
on securities available for sale . . . . . . . . . . . . . . . . . . . . . . . . . . . . . . . . . . . 881,885 718,431 398,316
Purchases of securities available for sale . . . . . . . . . . . . . . . . . . . . . . . . . . . . . . (871,559) (1,973,974) (587,324)
Net (increase) decrease in Federal Home Loan Bank stock . . . . . . . . . . . . . . . . . 79,307 3,126 (18,927)
Purchases of premises and equipment . . . . . . . . . . . . . . . . . . . . . . . . . . . . . . . . (69,782) (60,279) (44,682)
Sales of deposits, net of cash paid . . . . . . . . . . . . . . . . . . . . . . . . . . . . . . . . . . . –(15,206) (26,958)
Repayment of loans to deferred compensation plans . . . . . . . . . . . . . . . . . . . . . –9,783 (4,646)
Other, net . . . . . . . . . . . . . . . . . . . . . . . . . . . . . . . . . . . . . . . . . . . . . . . . . . . . . . 7,648 92 (15,544)
Net cash provided (used) by investing activities . . . . . . . . . . . . . . . . . . . . . 543,199 (853,953) (82,692)
Cash flows from financing activities:
Net increase (decrease) in deposits . . . . . . . . . . . . . . . . . . . . . . . . . . . . . . . . . . (98,239) 628,142 237,180
Net increase (decrease) in short-term borrowings . . . . . . . . . . . . . . . . . . . . . . . 36,361 122,192 (178,836)
Proceeds from long-term borrowings . . . . . . . . . . . . . . . . . . . . . . . . . . . . . . . . . . 425,469 52,462 677,334
Payments on long-term borrowings . . . . . . . . . . . . . . . . . . . . . . . . . . . . . . . . . . . (1,147,876) (11,665) (579,529)
Purchases of common stock . . . . . . . . . . . . . . . . . . . . . . . . . . . . . . . . . . . . . . . . (150,356) (148,030) (148,043)
Dividends paid on common stock . . . . . . . . . . . . . . . . . . . . . . . . . . . . . . . . . . . . (93,029) (86,430) (77,473)
Other, net . . . . . . . . . . . . . . . . . . . . . . . . . . . . . . . . . . . . . . . . . . . . . . . . . . . . . . 1,211 2,029 1,364
Net cash provided (used) by financing activities . . . . . . . . . . . . . . . . . . . . . (1,026,459) 558,700 (68,003)
Net increase (decrease) in cash and due from banks . . . . . . . . . . . . . . . . . . . . . . . . . (46,343) 29,697 (5,307)
Cash and due from banks at beginning of year . . . . . . . . . . . . . . . . . . . . . . . . . . . . . 416,397 386,700 392,007
Cash and due from banks at end of year . . . . . . . . . . . . . . . . . . . . . . . . . . . . . . . . . . $ 370,054 $ 416,397 $ 386,700
Supplemental disclosures of cash flow information:
Cash paid for:
Interest on deposits and borrowings . . . . . . . . . . . . . . . . . . . . . . . . . . . . . . . $ 157,751 $ 234,046 $ 352,903
Income taxes . . . . . . . . . . . . . . . . . . . . . . . . . . . . . . . . . . . . . . . . . . . . . . . . $ 139,120 $ 87,899 $ 24,128
Transfer of loans and leases to other assets . . . . . . . . . . . . . . . . . . . . . . . . . . . . $ 44,292 $ 51,713 $ 33,447
See accompanying notes to consolidated financial statements.