TCF Bank 2003 Annual Report Download - page 5
Download and view the complete annual report
Please find page 5 of the 2003 TCF Bank annual report below. You can navigate through the pages in the report by either clicking on the pages listed below, or by using the keyword search tool below to find specific information within the annual report.-
 1
1 -
 2
2 -
 3
3 -
 4
4 -
 5
5 -
 6
6 -
 7
7 -
 8
8 -
 9
9 -
 10
10 -
 11
11 -
 12
12 -
 13
13 -
 14
14 -
 15
15 -
 16
16 -
17
-
18
-
19
-
20
-
21
-
22
-
23
-
24
-
25
-
26
-
27
-
28
-
29
-
30
-
31
-
32
-
33
-
34
-
35
-
36
-
37
-
38
-
39
-
40
-
41
-
42
-
43
-
44
-
45
-
46
-
47
-
48
-
49
-
50
-
51
-
52
-
53
-
54
-
55
-
56
-
57
-
58
-
59
-
60
-
61
-
62
-
63
-
64
-
65
-
66
-
67
-
68
-
69
-
70
-
71
-
72
-
73
-
74
-
75
-
76
-
77
-
78
-
79
-
80
-
81
-
82
-
83
-
84
-
85
-
86
 |
 |

2003 Annual Report 3
There are several significant factors which inhibited TCF’s EPS growth in 2003. While some of these factors were not
our fault, all of them are our responsibility.
1. A major negative impact on TCF in 2003 was the unanticipated 40-year lows experienced in interest rates. Due to
these historically low rates, TCF experienced extraordinary and unprecedented levels of prepayments. Residential
loans, home equity loans, commercial real estate loans and mortgage-backed securities prepaid or refinanced at unfore-
seen record levels. Residential loans and mortgage-backed securities shrank $1.5 billion in total during the year. We
chose not to replace this runoff with low-yielding, long-term fixed rate assets. Although this decision had a negative
impact on our net interest income, we believe this decision was in the best long-term interest of TCF.
2. As a result of the refinancing boom experienced in 2003, loan yields fell faster and further than we could reduce our
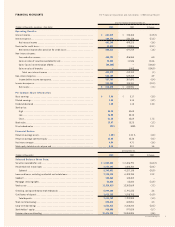
cost of funds, lowering our net interest margin to 4.54 percent, compared to 4.71 percent in 2002.
Because of TCF’s high percentage of low cost core deposits and the fixed rate longer maturity nature of our borrow-
ings, TCF was unable to lower the cost of funds to the same degree as the reduction of the yield on earning assets.
TCF’s cost of borrowings was 4.08 percent in 2003, as compared to 4.87 percent in 2002. In hindsight, more of
our borrowings should have been variable rate.
The weighted average rate of TCF’s deposits was .53 percent at December 31, 2003. This rate is one of the lowest in
the country and results from TCF’s large base of checking and savings deposits. Most of TCF’s checking accounts do
not pay any interest so the rate cannot be changed.
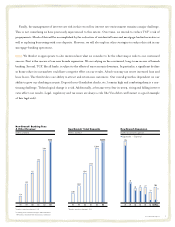
Fees and Other Revenue
(millions of dollars)
03
$431
$406
$367
$323
$274
02010099
Net Income
(millions of dollars)
03
$216
$233
$207
$186
$166
02010099
Diluted EPS
(dollars)
03
$3.05
$3.15
$2.70
$2.35
$2.00
02010099