TCF Bank 2003 Annual Report Download - page 41
Download and view the complete annual report
Please find page 41 of the 2003 TCF Bank annual report below. You can navigate through the pages in the report by either clicking on the pages listed below, or by using the keyword search tool below to find specific information within the annual report.-
 1
1 -
2
-
3
-
4
-
5
-
6
-
7
-
8
-
9
-
10
-
11
-
12
-
13
-
14
-
15
-
16
-
17
-
18
-
19
-
20
-
21
-
22
-
23
-
24
-
25
-
26
-
27
-
28
-
29
-
30
-
 31
31 -
 32
32 -
 33
33 -
 34
34 -
 35
35 -
 36
36 -
 37
37 -
 38
38 -
 39
39 -
 40
40 -
 41
41 -
 42
42 -
 43
43 -
 44
44 -
 45
45 -
 46
46 -
 47
47 -
 48
48 -
 49
49 -
 50
50 -
 51
51 -
52
-
53
-
54
-
55
-
56
-
57
-
58
-
59
-
60
-
61
-
62
-
63
-
64
-
65
-
66
-
67
-
68
-
69
-
70
-
71
-
72
-
73
-
74
-
75
-
76
-
77
-
78
-
79
-
80
-
81
-
82
-
83
-
84
-
85
-
86
 |
 |

2003 Annual Report 39
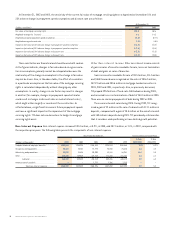
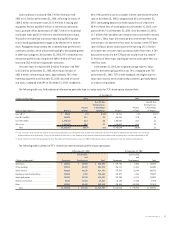
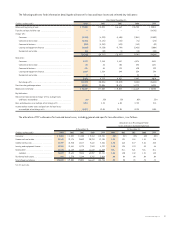
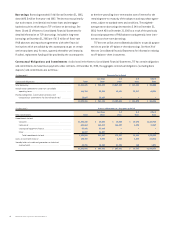
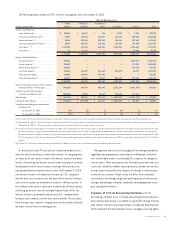
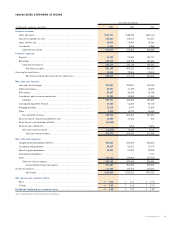
Non-performing assets are summarized in the following table:
At December 31,
(Dollars in thousands) 2003 2002 2001 2000 1999
Non-accrual loans and leases:
Consumer . . . . . . . . . . . . . . . . . . . . . . . . . . . . . . . . . . . . . . . . . . . $12,052 $11,163 $16,473 $13,027 $12,178
Commercial real estate . . . . . . . . . . . . . . . . . . . . . . . . . . . . . . . . 2,490 3,213 11,135 5,820 1,576
Commercial business . . . . . . . . . . . . . . . . . . . . . . . . . . . . . . . . . . 2,931 4,777 3,550 236 2,960
Leasing and equipment finance, net . . . . . . . . . . . . . . . . . . . . . . 13,241 17,127 11,723 7,376 1,310
Residential real estate . . . . . . . . . . . . . . . . . . . . . . . . . . . . . . . . 3,993 5,798 6,959 4,829 5,431
Total non-accrual loans and leases, net . . . . . . . . . . . . . . . . 34,707 42,078 49,840 31,288 23,455
Non-recourse discounted lease rentals . . . . . . . . . . . . . . . . . . . . . . . 699 1,562 2,134 3,910 619
Total non-accrual loans and leases, gross . . . . . . . . . . . . . . 35,406 43,640 51,974 35,198 24,074
Other real estate owned:
Residential . . . . . . . . . . . . . . . . . . . . . . . . . . . . . . . . . . . . . . . . . 20,462 16,479 12,830 10,422 9,454
Commercial . . . . . . . . . . . . . . . . . . . . . . . . . . . . . . . . . . . . . . . . . . 12,992 10,093 1,825 447 1,458
Total other real estate owned . . . . . . . . . . . . . . . . . . . . . . . . 33,454 26,572 14,655 10,869 10,912
Total non-performing assets, gross . . . . . . . . . . . . . . . . . . . $68,860 $70,212 $66,629 $46,067 $34,986
Total non-performing assets, net . . . . . . . . . . . . . . . . . . . . . $68,161 $68,650 $64,495 $42,157 $34,367
Gross non-performing assets as a percentage
of net loans and leases . . . . . . . . . . . . . . . . . . . . . . . . . . . . . . . . .83% .87% .82% .54% .45%
Gross non-performing assets as a percentage of total assets . . . . . . .61 .58 .59 .41 .33
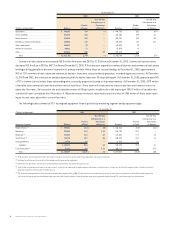
Included in non-performing assets are loans that are considered impaired. The recorded investment in impaired loans was $9.1 million and
$12.1 million at December 31, 2003 and December 31, 2002, respectively. The related allowance for credit losses was $4.5 million at December 31,
2003, compared with $5.5 million at December 31, 2002. All of the impaired loans were on non-accrual status. There were no impaired loans at
December 31, 2003 and 2002 which did not have a related allowance for loan losses. The average recorded investment in impaired loans was
$10.8 million for 2003, compared with $14.7 million for 2002.
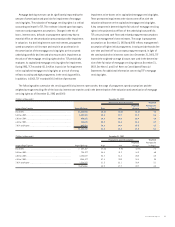
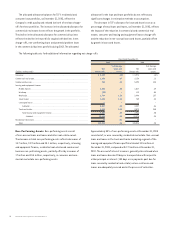
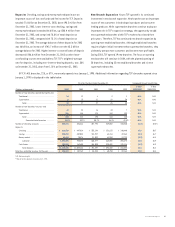
Past Due Loans and Leases The following table sets forth information regarding TCF’s delinquent loan and lease portfolio, excluding loans
held for sale and non-accrual loans and leases. TCF’s delinquency rates are determined using the contractual method.
At December 31,
2003 2002
Percentage of Percentage of
Principal Loans and Principal Loans and
(Dollars in thousands) Balances Leases Balances Leases
Accruing loans and leases delinquent for:
30-59 days . . . . . . . . . . . . . . . . . . . . . . . . . . . . . . . . . . . . . . . . . . . . . . . . . . . . . . . . . . .$24,187 .29% $24,683 .31%
60-89 days . . . . . . . . . . . . . . . . . . . . . . . . . . . . . . . . . . . . . . . . . . . . . . . . . . . . . . . . . . .8,953 .11 16,557 .20
90 days or more . . . . . . . . . . . . . . . . . . . . . . . . . . . . . . . . . . . . . . . . . . . . . . . . . . . . . . 5,604 .07 5,084 .06
Total . . . . . . . . . . . . . . . . . . . . . . . . . . . . . . . . . . . . . . . . . . . . . . . . . . . . . . . . . . . . . . . . $38,744 .47% $46,324 .57%
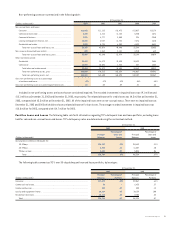
The following table summarizes TCF’s over 30-day delinquent loan and lease portfolio, by loan type:
At December 31,
2003 2002
Principal Percentage of Principal Percentage of
(Dollars in thousands) Balances Portfolio Balances Portfolio
Consumer . . . . . . . . . . . . . . . . . . . . . . . . . . . . . . . . . . . . . . . . . . . . . . . . . . . . . . . . . . . . . . . . . . $17,673 .49% $19,067 .64%
Commercial real estate . . . . . . . . . . . . . . . . . . . . . . . . . . . . . . . . . . . . . . . . . . . . . . . . . . . . . . . . 58 – 6,835 .37
Commercial business . . . . . . . . . . . . . . . . . . . . . . . . . . . . . . . . . . . . . . . . . . . . . . . . . . . . . . . . . . 282 .07 555 .13
Leasing and equipment finance . . . . . . . . . . . . . . . . . . . . . . . . . . . . . . . . . . . . . . . . . . . . . 10,619 .93 10,159 1.00
Residential real estate . . . . . . . . . . . . . . . . . . . . . . . . . . . . . . . . . . . . . . . . . . . . . . . . . . . . 10,112 .84 9,708 .54
Total . . . . . . . . . . . . . . . . . . . . . . . . . . . . . . . . . . . . . . . . . . . . . . . . . . . . . . . . . . . . . . . . . $38,744 .47 $46,324 .57