TCF Bank 2003 Annual Report Download - page 71
Download and view the complete annual report
Please find page 71 of the 2003 TCF Bank annual report below. You can navigate through the pages in the report by either clicking on the pages listed below, or by using the keyword search tool below to find specific information within the annual report.-
 1
1 -
2
-
3
-
4
-
5
-
6
-
7
-
8
-
9
-
10
-
11
-
12
-
13
-
14
-
15
-
16
-
17
-
18
-
19
-
20
-
21
-
22
-
23
-
24
-
25
-
26
-
27
-
28
-
29
-
30
-
31
-
32
-
33
-
34
-
35
-
36
-
37
-
38
-
39
-
40
-
41
-
42
-
43
-
44
-
45
-
46
-
47
-
48
-
49
-
50
-
51
-
52
-
53
-
54
-
55
-
56
-
57
-
58
-
59
-
60
-
 61
61 -
 62
62 -
 63
63 -
 64
64 -
 65
65 -
 66
66 -
 67
67 -
 68
68 -
 69
69 -
 70
70 -
 71
71 -
 72
72 -
 73
73 -
 74
74 -
 75
75 -
 76
76 -
 77
77 -
 78
78 -
 79
79 -
 80
80 -
 81
81 -
82
-
83
-
84
-
85
-
86
 |
 |

2003 Annual Report 69
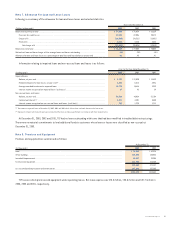
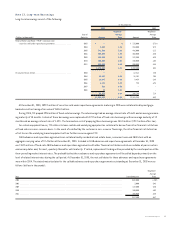
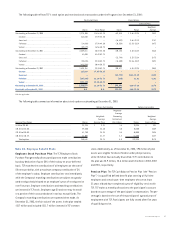
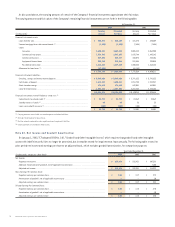
Net periodic benefit cost (credit) included in compensation and employee benefits expense consists of the following:
Pension Plan Postretirement Plan
Year Ended December 31, Year Ended December 31,
(In thousands) 2003 2002 2001 2003 2002 2001
Service cost . . . . . . . . . . . . . . . . . . . . . . . . . . . . . . $ 3,950 $ 3,547 $ 2,969 $60 $ 48 $ 49
Interest cost . . . . . . . . . . . . . . . . . . . . . . . . . . . . 2,950 2,857 2,480 740 685 547
Expected return on plan assets . . . . . . . . . . . . . (6,374) (7,683) (7,156) –––
Amortization of transition obligation . . . . . . . . –– – 210 210 209
Amortization of prior service cost . . . . . . . . . . . (361) (1,056) (1,057) –– –
Recognized actuarial (gain) loss . . . . . . . . . . . – (387) (1,810) 226 38 (3)
Net periodic benefit cost (credit) . . . . . . . . $165 $(2,722) $(4,574) $ 1,236 $ 981 $ 802
The discount rate, the expected long-term rate of return on plan assets and the rate of increase in future compensation used to determine
the net benefit cost (credit) were as follows:
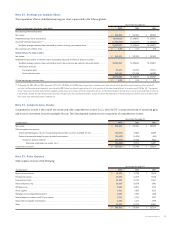
Pension Plan Postretirement Plan
Assumptions used to determine Year Ended December 31, Year Ended December 31,
net periodic benefit cost (credit) 2003 2002 2001 2003 2002 2001
Discount rate . . . . . . . . . . . . . . . . . . . . . . . . . . 6.5% 7.5% 7.5% 6.5% 7.5% 7.5%
Expected long-term rate of return
on plan assets . . . . . . . . . . . . . . . . . . . . . . 8.5 10.0 10.0 N.A. N.A. N.A.
Rate of compensation increase . . . . . . . . . . . . . 4.5 4.5 4.5 N.A. N.A. N.A.
N.A. Not applicable.
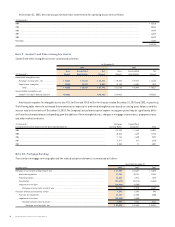
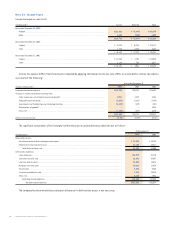
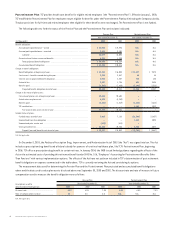
TCF’s pension plan asset allocation is summarized as follows:
Pension Plan
Percentage of Plan Assets
at December 31
Asset Category 2003 2002
Equity securities, excluding TCF Financial Corporation common stock . . . . . . . . . . . . . . . . . . . . . . . . . . . . . . . . . . . . . . . . . . . . . . . . . . . 75% 67%
Fixed income securities . . . . . . . . . . . . . . . . . . . . . . . . . . . . . . . . . . . . . . . . . . . . . . . . . . . . . . . . . . . . . . . . . . . . . . . . . . . . . . . . . . . . . 21 26
Cash equivalents . . . . . . . . . . . . . . . . . . . . . . . . . . . . . . . . . . . . . . . . . . . . . . . . . . . . . . . . . . . . . . . . . . . . . . . . . . . . . . . . . . . . . . . . . . . . . . . 25
TCF Financial Corporation common stock . . . . . . . . . . . . . . . . . . . . . . . . . . . . . . . . . . . . . . . . . . . . . . . . . . . . . . . . . . . . . . . . . . . . . . . . . 22
Total . . . . . . . . . . . . . . . . . . . . . . . . . . . . . . . . . . . . . . . . . . . . . . . . . . . . . . . . . . . . . . . . . . . . . . . . . . . . . . . . . . . . . . . . . . . . . . . . . . . . . . . . . . 100% 100%
The assets in TCF’s pension plan are managed by external investment managers. The plan’s investment policy allows the investment manager
to determine the mix of equity and fixed income debt securities and the individual investments held. No single investment, other than U.S. gov-
ernment securities, may exceed 5% of plan assets, foreign securities are also limited to 5% and the use of derivative instruments is prohibited.
The results of the investment managers performance is periodically monitored and is compared with a benchmark return consisting of 75% S&P
500 Index and 25% Lehman Brothers Aggregate Bond Index returns.
The actuarial assumptions used in the pension plan valuation are reviewed annually. The expected long-term rate of return on plan assets is
changed based on historical returns on plan assets and adjusted for future expectations of returns, if necessary. Over the past 20 years, TCF’s
pension plan assets have achieved actual returns, net of investment management fees, of 10.6%. TCF is not aware of any reasons why it should
not be able to achieve future average annual returns of 8.5% long-term expected return on plan assets assumption over complete market cycles.
A 1% difference in the expected return on plan assets would result in a $701 thousand change in net periodic pension expense.
TCF currently does not expect to contribute to the Pension Plan in 2004. TCF expects to contribute approximately $1.1 million to the
Postretirement Plan in 2004.
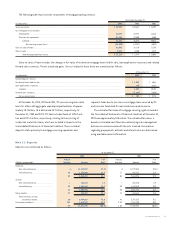
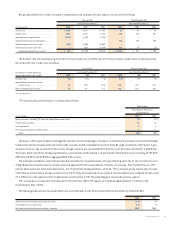
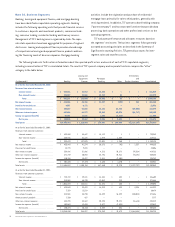
The following table presents assumed health care cost trend rates for the Postretirement Plan at December 31, 2003 and 2002:
2003 2002
Health care cost trend rate assumed for next year . . . . . . . . . . . . . . . . . . . . . . . . . . . . . . . . . . . . . . . . . . . . . . . . . . . . . . . . . . . . . . . . . . . 11.0% 12%
Final health care cost trend rate . . . . . . . . . . . . . . . . . . . . . . . . . . . . . . . . . . . . . . . . . . . . . . . . . . . . . . . . . . . . . . . . . . . . . . . . . . . . . . 5.0% 5%
Year that the final health care trend rate is reached . . . . . . . . . . . . . . . . . . . . . . . . . . . . . . . . . . . . . . . . . . . . . . . . . . . . . . . . . . . . . . . 2009 2009