TCF Bank 2003 Annual Report Download - page 74
Download and view the complete annual report
Please find page 74 of the 2003 TCF Bank annual report below. You can navigate through the pages in the report by either clicking on the pages listed below, or by using the keyword search tool below to find specific information within the annual report.-
 1
1 -
2
-
3
-
4
-
5
-
6
-
7
-
8
-
9
-
10
-
11
-
12
-
13
-
14
-
15
-
16
-
17
-
18
-
19
-
20
-
21
-
22
-
23
-
24
-
25
-
26
-
27
-
28
-
29
-
30
-
31
-
32
-
33
-
34
-
35
-
36
-
37
-
38
-
39
-
40
-
41
-
42
-
43
-
44
-
45
-
46
-
47
-
48
-
49
-
50
-
51
-
52
-
53
-
54
-
55
-
56
-
57
-
58
-
59
-
60
-
61
-
62
-
63
-
 64
64 -
 65
65 -
 66
66 -
 67
67 -
 68
68 -
 69
69 -
 70
70 -
 71
71 -
 72
72 -
 73
73 -
 74
74 -
 75
75 -
 76
76 -
 77
77 -
 78
78 -
 79
79 -
 80
80 -
 81
81 -
 82
82 -
 83
83 -
 84
84 -
85
-
86
 |
 |

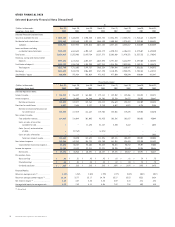
72 TCF Financial Corporation and Subsidiaries
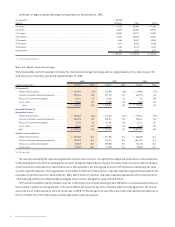
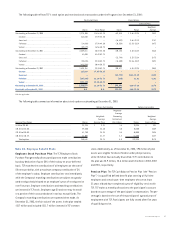
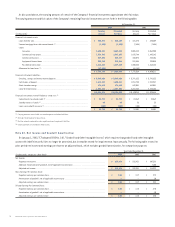
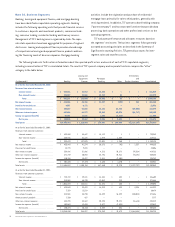
As discussed above, the carrying amounts of certain of the Company’s financial instruments approximate their fair value.
The carrying amounts and fair values of the Company’s remaining financial instruments are set forth in the following table:
At December 31,
2003 2002
Carrying Estimated Carrying Estimated
(In thousands) Amount Fair Value Amount Fair Value
Financial instrument assets:
Loans held for sale . . . . . . . . . . . . . . . . . . . . . . . . . . . . . . . . . . . . . . . . . . . . . . . . . . . . . . $ 335,372 $ 340,189 $ 476,475 $ 480,409
Forward mortgage loan sales commitments (1) . . . . . . . . . . . . . . . . . . . . . . . . . . . . . . . . (1,105) (1,105) (7,454) (7,454)
Loans:
Consumer . . . . . . . . . . . . . . . . . . . . . . . . . . . . . . . . . . . . . . . . . . . . . . . . . . . . . . . . . . . 3,630,341 3,649,810 3,005,882 3,068,900
Commercial real estate . . . . . . . . . . . . . . . . . . . . . . . . . . . . . . . . . . . . . . . . . . . . . . 1,916,701 1,947,267 1,835,788 1,883,183
Commercial business . . . . . . . . . . . . . . . . . . . . . . . . . . . . . . . . . . . . . . . . . . . . . . . 427,696 429,727 440,074 438,106
Equipment finance loans . . . . . . . . . . . . . . . . . . . . . . . . . . . . . . . . . . . . . . . . . . . . . . . . . 309,740 312,948 289,558 299,035
Residential real estate . . . . . . . . . . . . . . . . . . . . . . . . . . . . . . . . . . . . . . . . . . . . . . 1,212,643 1,247,610 1,800,344 1,868,132
Allowance for loan losses (2) . . . . . . . . . . . . . . . . . . . . . . . . . . . . . . . . . . . . . . . . . . . . . (67,654) – (68,143) –
$ 7,763,734 $ 7,926,446 $ 7,772,524 $ 8,030,311
Financial instrument liabilities:
Checking, savings and money market deposits . . . . . . . . . . . . . . . . . . . . . . . . . . . . . . . . $ 5,999,626 $ 5,999,626 $ 5,791,233 $ 5,791,233
Certificates of deposit . . . . . . . . . . . . . . . . . . . . . . . . . . . . . . . . . . . . . . . . . . . . . . . . . . 1,612,123 1,630,511 1,918,755 1,948,947
Short-term borrowings . . . . . . . . . . . . . . . . . . . . . . . . . . . . . . . . . . . . . . . . . . . . . . . . . . . . . . 878,412 878,615 842,051 842,051
Long-term borrowings . . . . . . . . . . . . . . . . . . . . . . . . . . . . . . . . . . . . . . . . . . . . . . . . . . . . . . . . . . 1,536,413 1,627,253 2,268,244 2,443,653
$10,026,574 $10,136,005 $10,820,283 $11,025,884
Financial instruments with off-balance-sheet risk: (3)
Commitments to extend credit (4) . . . . . . . . . . . . . . . . . . . . . . . . . . . . . . . . . . . . . . . . . . $ 22,773 $ 22,773 $ 24,569 $ 24,569
Standby letters of credit (1) . . . . . . . . . . . . . . . . . . . . . . . . . . . . . . . . . . . . . . . . . . . . . . . . . . . . . . . . 43 43 32 32
Loans serviced with recourse (1) . . . . . . . . . . . . . . . . . . . . . . . . . . . . . . . . . . . . . . . . . . . . . . . . . . . . (100) (100) (100) (100)
$ 22,716 $ 22,716 $ 24,501 $ 24,501
(1) Carrying amounts are included in accrued expenses and other liabilities.
(2) Excludes the allowance for lease losses.
(3) Positive amounts represent assets, negative amounts represent liabilities.
(4) Carrying amounts are included in other assets.
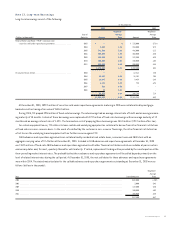
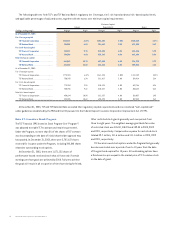
Note 22. Net Income and Goodwill Amortization
On January 1, 2002, TCF adopted SFAS No. 142, “Goodwill and Other Intangible Assets,” which requires that goodwill and other intangible
assets with indefinite useful lives no longer be amortized, but instead be tested for impairment at least annually. The following table reconciles
prior period net income and earnings per share to an adjusted basis, which excludes goodwill amortization, for comparison purposes:
Year Ended December 31,
(In thousands, except per-share data) 2003 2002 2001
Net Income:
Reported net income . . . . . . . . . . . . . . . . . . . . . . . . . . . . . . . . . . . . . . . . . . . . . . . . . . . . . . . . . . . . . . . . . . . $ 215,878 $ 232,931 $ 207,322
Add back: Amortization of goodwill, net of applicable income taxes . . . . . . . . . . . . . . . . . . . . . . . . . . . . . . .– – 7,600
Adjusted net income . . . . . . . . . . . . . . . . . . . . . . . . . . . . . . . . . . . . . . . . . . . . . . . . . . . . . . . . . . . . . . . . . . . . . . . $ 215,878 $ 232,931 $ 214,922
Basic Earnings Per Common Share:
Reported earnings per common share . . . . . . . . . . . . . . . . . . . . . . . . . . . . . . . . . . . . . . . . . . . . . . . . . . . . . . $ 3.06 $ 3.17 $ 2.73
Amortization of goodwill, net of applicable income taxes . . . . . . . . . . . . . . . . . . . . . . . . . . . . . . . . . . . . . . . –– .10
Adjusted earnings per common share . . . . . . . . . . . . . . . . . . . . . . . . . . . . . . . . . . . . . . . . . . . . . . . . . . . . . . . . . . . $ 3.06 $ 3.17 $ 2.83
Diluted Earnings Per Common Share:
Reported earnings per common share . . . . . . . . . . . . . . . . . . . . . . . . . . . . . . . . . . . . . . . . . . . . . . . . . . . . . . $ 3.05 $ 3.15 $ 2.70
Amortization of goodwill, net of applicable income taxes . . . . . . . . . . . . . . . . . . . . . . . . . . . . . . . . . . . . . . . –– .10
Adjusted earnings per common share . . . . . . . . . . . . . . . . . . . . . . . . . . . . . . . . . . . . . . . . . . . . . . . . . . . . . . . . . . . $ 3.05 $ 3.15 $ 2.80