TCF Bank 2001 Annual Report Download - page 71
Download and view the complete annual report
Please find page 71 of the 2001 TCF Bank annual report below. You can navigate through the pages in the report by either clicking on the pages listed below, or by using the keyword search tool below to find specific information within the annual report.-
 1
1 -
2
-
3
-
4
-
5
-
6
-
7
-
8
-
9
-
10
-
11
-
12
-
13
-
14
-
15
-
16
-
17
-
18
-
19
-
20
-
21
-
22
-
23
-
24
-
25
-
26
-
27
-
28
-
29
-
30
-
31
-
32
-
33
-
34
-
35
-
36
-
37
-
38
-
39
-
40
-
41
-
42
-
43
-
44
-
45
-
46
-
47
-
48
-
49
-
50
-
51
-
52
-
53
-
54
-
55
-
56
-
57
-
58
-
59
-
60
-
 61
61 -
 62
62 -
 63
63 -
 64
64 -
 65
65 -
 66
66 -
 67
67 -
 68
68 -
 69
69 -
 70
70 -
 71
71 -
 72
72 -
 73
73 -
 74
74 -
 75
75 -
 76
76 -
 77
77 -
 78
78 -
 79
79 -
 80
80 -
 81
81 -
82
 |
 |

69
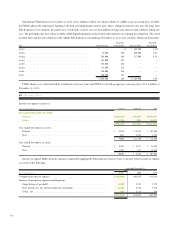
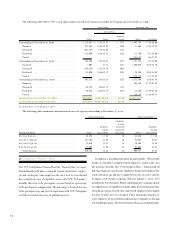
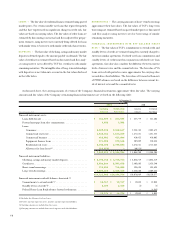
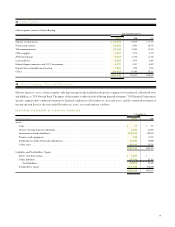
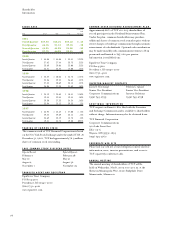
21 Earnings Per Common Share
The computation of basic and diluted earnings per share is presented in the following table:
Year Ended December 31,
(Dollars in thousands, except per-share data) 2001 2000 1999
Basic Earnings Per Common Share
Net income . . . . . . . . . . . . . . . . . . . . . . . . . . . . . . . . . . . . . . . . . . . . . . . . . . . . . $ 207,322 $ 186,245 $ 166,039
Weighted average common shares outstanding . . . . . . . . . . . . . . . . . . . . . . . . . . . . 75,825,017 78,648,765 82,445,288
Basic earnings per common share . . . . . . . . . . . . . . . . . . . . . . . . . . . . . . . . . . . . . $ 2.73 $ 2.37 $ 2.01
Diluted Earnings Per Common Share
Net income . . . . . . . . . . . . . . . . . . . . . . . . . . . . . . . . . . . . . . . . . . . . . . . . . . . . . . $ 207,322 $ 186,245 $ 166,039
Weighted average number of common shares outstanding adjusted for effect of
dilutive securities:
Weighted average common shares outstanding used in basic earnings per
common share calculation. . . . . . . . . . . . . . . . . . . . . . . . . . . . . . . . . . . 75,825,017 78,648,765 82,445,288
Net dilutive effect of:
Stock option plans . . . . . . . . . . . . . . . . . . . . . . . . . . . . . . . . . . . . . . . . 149,711 113,338 172,486
Restricted stock plans . . . . . . . . . . . . . . . . . . . . . . . . . . . . . . . . . . . . . . 868,209 626,572 452,944
76,842,937 79,388,675 83,070,718
Diluted earnings per common share . . . . . . . . . . . . . . . . . . . . . . . . . . . . . . . . . . . $ 2.70 $ 2.35 $ 2.00
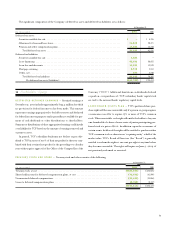
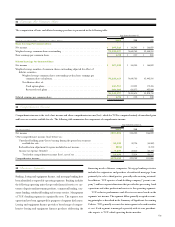
22 Comprehensive Income
Comprehensive income is the total of net income and other comprehensive income (loss), which for TCF is comprised entirely of unrealized gains
and losses on securities available for sale. The following table summarizes the components of comprehensive income:
Year Ended December 31,
(In thousands) 2001 2000 1999
Net income . . . . . . . . . . . . . . . . . . . . . . . . . . . . . . . . . . . . . . . . . . . . . . . . . . . . . . . $207,322 $186,245 $166,039
Other comprehensive income (loss) before tax:
Unrealized holding gains (losses) arising during the period on securities
available for sale . . . . . . . . . . . . . . . . . . . . . . . . . . . . . . . . . . . . . . . . . . . . . . . 26,295 59,726 (84,503)
Reclassification adjustment for gains included in net income . . . . . . . . . . . . . . . . . (863) – (3,194)
Income tax expense (benefit) . . . . . . . . . . . . . . . . . . . . . . . . . . . . . . . . . . . . . . . . 9,335 22,212 (32,724)
Total other comprehensive income (loss), net of tax . . . . . . . . . . . . . . . . . . . . . 16,097 37,514 (54,973)
Comprehensive income. . . . . . . . . . . . . . . . . . . . . . . . . . . . . . . . . . . . . . . . . . . . . . . $223,419 $223,759 $111,066
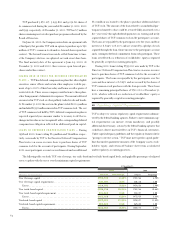
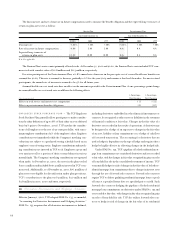
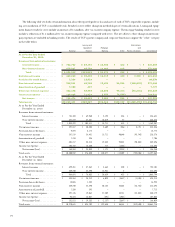
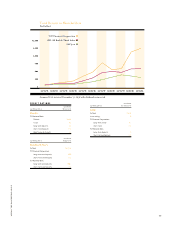
23 Business Segments
Banking, leasing and equipment finance, and mortgage banking have
been identified as reportable operating segments. Banking includes
the following operating units that provide financial services to cus-
tomers: deposits and investment products, commercial lending, con-
sumer lending, residential lending and treasury services. Management
of TCF’s banking segment is organized by state. The separate state
operations have been aggregated for purposes of segment disclosures.
Leasing and equipment finance provides a broad range of compre-
hensive leasing and equipment finance products addressing the
financing needs of diverse companies. Mortgage banking activities
include the origination and purchase of residential mortgage loans
primarily for sale to third parties, generally with servicing retained.
In addition, TCF operates a bank holding company (“parent com-
pany”) and has corporate functions that provide data processing, bank
operations and other professional services to the operating segments.
TCF evaluates performance and allocates resources based on the
segments’ net income. The segments follow generally accepted account-
ing principles as described in the Summary of Significant Accounting
Policies. TCF generally accounts for intersegment sales and transfers
at cost. Each segment is managed separately with its own president,
who reports to TCF’s chief operating decision maker.