TCF Bank 2001 Annual Report Download - page 26
Download and view the complete annual report
Please find page 26 of the 2001 TCF Bank annual report below. You can navigate through the pages in the report by either clicking on the pages listed below, or by using the keyword search tool below to find specific information within the annual report.-
 1
1 -
2
-
3
-
4
-
5
-
6
-
7
-
8
-
9
-
10
-
11
-
12
-
13
-
14
-
15
-
 16
16 -
 17
17 -
 18
18 -
 19
19 -
 20
20 -
 21
21 -
 22
22 -
 23
23 -
 24
24 -
 25
25 -
 26
26 -
 27
27 -
 28
28 -
 29
29 -
 30
30 -
 31
31 -
 32
32 -
 33
33 -
 34
34 -
 35
35 -
 36
36 -
37
-
38
-
39
-
40
-
41
-
42
-
43
-
44
-
45
-
46
-
47
-
48
-
49
-
50
-
51
-
52
-
53
-
54
-
55
-
56
-
57
-
58
-
59
-
60
-
61
-
62
-
63
-
64
-
65
-
66
-
67
-
68
-
69
-
70
-
71
-
72
-
73
-
74
-
75
-
76
-
77
-
78
-
79
-
80
-
81
-
82
 |
 |

24
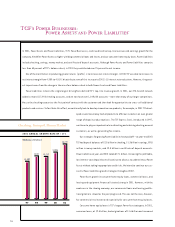
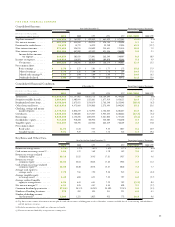
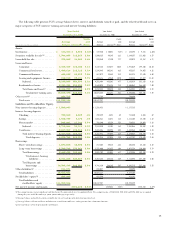
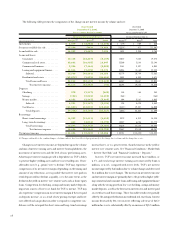
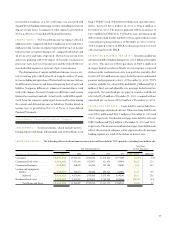
OPERATING SEGMENT RESULTS
Banking, comprised of deposits and investment products, commercial
lending, consumer lending, residential lending and treasury services,
reported net income of $180.5 million for 2001, up 9.9% from $164.3
million in 2000. Net interest income for 2001 was $423 million, com-
pared with $397.9 million for 2000. The provision for credit losses
totaled $7.4 million in 2001, down from $9.6 million in 2000. Non-
interest income (excluding gains on sales of branches and securities
available for sale) totaled $309.3 million, up 12.7% from $274.4 mil-
lion in 2000. This improvement was primarily due to increased fees
and service charges and electronic funds transfer revenues, reflecting
TCF’s expanded retail banking operations and customer base. Non-
interest expense (excluding the amortization of goodwill) totaled $432.3
million, up 7.7% from $401.2 million in 2000. The increase was pri-
marily due to the costs associated with TCF’s continued retail banking
expansion, including de novo supermarket branches, offset by cost sav-
ings from sales of underperforming branches.
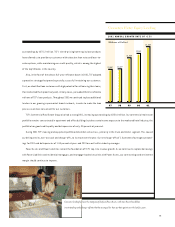
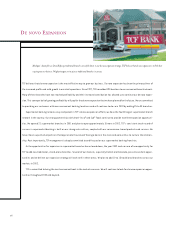
TCF has significantly expanded its banking franchise in recent
periods and had 375 banking branches at December 31, 2001. Since
January 1, 1998, TCF has opened 193 new branches, of which 176 were
supermarket branches. TCF continued to expand its retail banking
franchise by opening 27 new branches during 2001. TCF anticipates
opening between 25 and 30 new branches during 2002 (including
approximately 15 more supermarket branches) and plans to continue
expanding in future years.
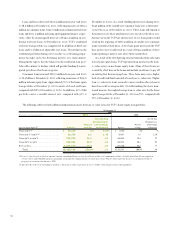
Leasing and Equipment Finance, an operating segment comprised of TCF’s
wholly owned subsidiaries Winthrop and TCF Leasing, provides a broad
range of comprehensive lease and equipment finance products. This
operating segment reported net income of $20.4 million for 2001,
down 11.3% from $23 million in 2000. Results for 2001 reflect changes
in methodologies of certain allocations from prior years. Leasing and
equipment finance results include an increase of $1.5 million, after
tax, in intercompany expense as a result of the change in methodolo-
gies. Net interest income for 2001 was $39.4 million, up 29.7% from
$30.4 million in 2000. Leasing and equipment finance’s provision
for credit losses totaled $13.5 million in 2001, up from $5.2 million
in 2000, primarily as a result of increased delinquencies and net
charge-offs coupled with growth in the portfolio. Non-interest income
totaled $45.7 million in 2001, up 18.9% from $38.5 million in
2000 due to higher levels of sales type lease revenues during 2001.
Non-interest expense (excluding the amortization of goodwill) totaled
$38.4 million in 2001, up 48.6% from $25.8 million in 2000
primarily as a result of the growth experienced in TCF Leasing.
Mortgage Banking activities include the origination and purchase of res-
idential mortgage loans, generally for sale to third parties with servic-
ing retained. This operating segment reported net income of $5.9
million for 2001, compared with $1.2 million for 2000. As a result of
changes in methodologies of certain allocations in 2001, the 2001 results
for the mortgage banking operating segment include a reduction in
intercompany expense of $1.2 million, after tax, compared with 2000.
Non-interest income totaled $15.4 million, down 1.7% from $15.7 mil-
lion in 2000. This decrease in non-interest income from 2000 is pri-
marily due to a $13.1 million decrease in net servicing income, partially
offset by increases of $10.4 million in gains on sales of loans held for
sale and $2.4 million in other income on higher volume of loan
originations. The decline in net servicing income from 2000 is attrib-
utable to a $16 million increase in amortization and impairment of
mortgage servicing rights, due to accelerating actual and assumed pre-
payments and increased volumes. As a result of declines in interest rates
during 2001, the mortgage banking segment has experienced an increase
in refinance activity. During 2001, this operating segment generated
$3.7 billion in new loan applications and $2.6 billion in closed loans,
up from $1.3 billion and $876.9 million, respectively for the same
2000 period. Refinances were 59% of originations for 2001, com-
pared with 19% for 2000. TCF’s mortgage pipeline (applications in
process, but not yet closed) was $606.7 million at December 31, 2001,
compared with $221.4 million at December 31, 2000. The third-
party servicing portfolio was $4.7 billion at December 31, 2001, with
a weighted average coupon of 7.13%, compared with $4 billion at
December 31, 2000, with a weighted average coupon of 7.42%.
Capitalized mortgage servicing rights totaled $58.3 million, or 1.25%
of the servicing portfolio, at December 31, 2001, compared with $40.1
million, or 1.01%, at December 31, 2000. Non-interest expense
totaled $20.9 million for 2001, up 7.5% from $19.4 million for
2000. Contributing to the increase in non-interest expense during
2001 were increased expenses resulting from the high level of loan
originations during the year.
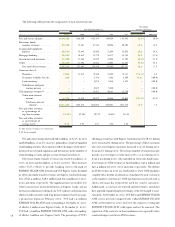
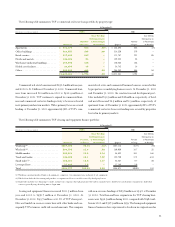
Consolidated Income Statement Analysis
NET INTEREST INCOME – Net interest income, which is the dif-
ference between interest earned on loans and leases, securities available
for sale, investments and other interest-earning assets (interest income),
and interest paid on deposits and borrowings (interest expense), repre-
sented 56.4% of TCF’s revenue in 2001. Net interest income divided
by average interest-earning assets is referred to as the net interest mar-
gin, expressed as a percentage. Net interest income and net interest mar-
gin are affected by changes in interest rates, loan pricing strategies and
competitive conditions, the volume and the mix of interest-earning assets
and interest-bearing liabilities, and the level of non-performing assets.
Net interest income was $481.2 million for the year ended December
31, 2001, compared with $438.5 million in 2000 and $424.2 million
in 1999. This represents an increase of 9.7% in 2001, compared with
an increase of 3.4% in 2000 and a decrease of .4% in 1999. Total aver-
age interest-earning assets increased 5.9% in 2001, following increases
of 6.1% in 2000 and 7.9% in 1999. The net interest margin for 2001
was 4.51%, compared with 4.35% in 2000 and 4.47% in 1999.