TCF Bank 2001 Annual Report Download - page 35
Download and view the complete annual report
Please find page 35 of the 2001 TCF Bank annual report below. You can navigate through the pages in the report by either clicking on the pages listed below, or by using the keyword search tool below to find specific information within the annual report.-
 1
1 -
2
-
3
-
4
-
5
-
6
-
7
-
8
-
9
-
10
-
11
-
12
-
13
-
14
-
15
-
16
-
17
-
18
-
19
-
20
-
21
-
22
-
23
-
24
-
 25
25 -
 26
26 -
 27
27 -
 28
28 -
 29
29 -
 30
30 -
 31
31 -
 32
32 -
 33
33 -
 34
34 -
 35
35 -
 36
36 -
 37
37 -
 38
38 -
 39
39 -
 40
40 -
 41
41 -
 42
42 -
 43
43 -
 44
44 -
 45
45 -
46
-
47
-
48
-
49
-
50
-
51
-
52
-
53
-
54
-
55
-
56
-
57
-
58
-
59
-
60
-
61
-
62
-
63
-
64
-
65
-
66
-
67
-
68
-
69
-
70
-
71
-
72
-
73
-
74
-
75
-
76
-
77
-
78
-
79
-
80
-
81
-
82
 |
 |

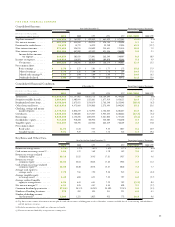
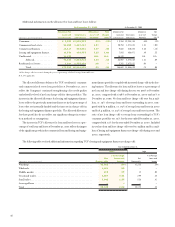
Leasing and equipment finance increased $100.3 million from
year-end 2000 to $956.7 million at December 31, 2001. At
December 31, 2001, $143.7 million or 20.6% of TCF’s lease port-
folio was funded on a non-recourse basis with other banks and con-
sequently TCF retains no credit risk on such amounts. This compares
with non-recourse fundings of $165.8 million or 25.4% at December
31, 2000. Total loan and lease originations for TCF’s leasing busi-
nesses were $492.3 million during 2001, compared with $648.1 mil-
lion in 2000 and $327.3 million in 1999. The leasing and equipment
finance businesses have experienced a slowdown in originations due
Commercial real estate loans increased $250.6 million from year-
end 2000 to $1.6 billion at December 31, 2001. Commercial busi-
ness loans increased $12 million in 2001 to $422.4 million at
December 31, 2001. TCF continues to expand its commercial busi-
ness and commercial real estate lending activity to borrowers located
in its primary midwestern markets. With a primary focus on secured
lending, at December 31, 2001, approximately 98% of TCF’s com-
mercial real estate and commercial business loans are secured either
by properties or underlying business assets. At December 31, 2001
and December 31, 2000, the construction and development port-
folio included $31.5 million and $28 million, respectively, of hotel
and motel loans and $2.5 million and $1.9 million, respectively, of
apartment loans. At December 31, 2001, approximately 86% of TCF’s
commercial real estate loans outstanding were secured by properties
located in its primary markets.
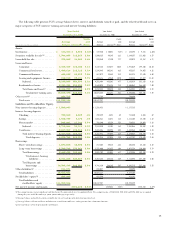
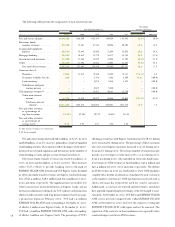
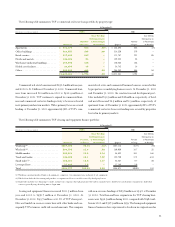
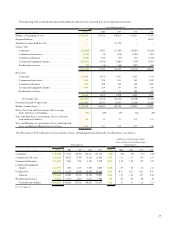
The following table summarizes TCF’s commercial real estate loan portfolio by property type:
At December 31,
(Dollars in thousands) 2001 2000
2
Over 30-Day Over 30-Day
Delinquency as Delinquency as
Number a Percentage Number a Percentage
Balance of Loans of Portfolio Balance of Loans of Portfolio
Apartments . . . . . . . . . . . . . . . . . . . . . $ 431,679 586 .03% $ 326,594 544 .12%
Office buildings . . . . . . . . . . . . . . . . . 364,357 283 .08 318,230 279 –
Retail services . . . . . . . . . . . . . . . . . . . 217,408 243 – 171,747 221 .05
Hotels and motels . . . . . . . . . . . . . . . . 144,424 34 – 159,383 34 –
Warehouse/industrial buildings. . . . . . . 159,090 165 – 120,852 156 –
Health care facilities. . . . . . . . . . . . . . . 24,698 15 – 28,783 18 –
Other . . . . . . . . . . . . . . . . . . . . . . . . . 280,805 448 .04 246,252 546 .54
$1,622,461 1,774 .03 $1,371,841 1,798 .13
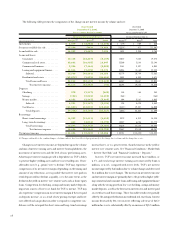
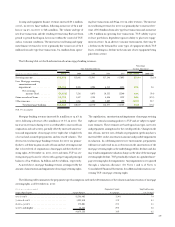
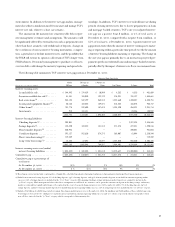
The following table summarizes TCF’s leasing and equipment finance portfolio:
At December 31,
(Dollars in thousands) 2001 2000
2
Over 30-Day Over 30-Day
Delinquency as Delinquency as
Percent a Percentage Percent a Percentage
Balance of Total of Portfolio Balance of Total of Portfolio
Winthrop(1) . . . . . . . . . . . . . . . . . . . . . . . $307,335 32.1% .24% $357,113 41.7% .73%
Wholesale(2) . . . . . . . . . . . . . . . . . . . . . . 204,792 21.4 .28 160,050 18.7 .35
Middle market . . . . . . . . . . . . . . . . . . . . . 181,826 19.0 2.14 86,532 10.1 1.66
Truck and trailer. . . . . . . . . . . . . . . . . . . 144,485 15.1 7.59 152,740 17.8 6.84
Small ticket(3) . . . . . . . . . . . . . . . . . . . . . 100,691 10.5 1.17 82,867 9.7 .80
Leveraged lease . . . . . . . . . . . . . . . . . . . . 17,608 1.9 – 17,169 2.0 –
Total . . . . . . . . . . . . . . . . . . . . . . . . . . . $956,737 100.0% 1.84 $856,471 100.0% 1.83
(1) Winthrop consists primarily of high-tech equipment, computers, telecommunications and point of sale equipment.
(2) Wholesale includes the discounting and purchase or origination of lease receivables sourced by third party lessors.
(3) Small ticket includes lease financings to small- and mid-size companies through programs with vendors, manufacturers, distributors and franchise organizations. Individual
contracts generally range from $25,000 to $250,000.
33