TCF Bank 2001 Annual Report Download - page 24
Download and view the complete annual report
Please find page 24 of the 2001 TCF Bank annual report below. You can navigate through the pages in the report by either clicking on the pages listed below, or by using the keyword search tool below to find specific information within the annual report.-
 1
1 -
2
-
3
-
4
-
5
-
6
-
7
-
8
-
9
-
10
-
11
-
12
-
13
-
 14
14 -
 15
15 -
 16
16 -
 17
17 -
 18
18 -
 19
19 -
 20
20 -
 21
21 -
 22
22 -
 23
23 -
 24
24 -
 25
25 -
 26
26 -
 27
27 -
 28
28 -
 29
29 -
 30
30 -
 31
31 -
 32
32 -
 33
33 -
 34
34 -
35
-
36
-
37
-
38
-
39
-
40
-
41
-
42
-
43
-
44
-
45
-
46
-
47
-
48
-
49
-
50
-
51
-
52
-
53
-
54
-
55
-
56
-
57
-
58
-
59
-
60
-
61
-
62
-
63
-
64
-
65
-
66
-
67
-
68
-
69
-
70
-
71
-
72
-
73
-
74
-
75
-
76
-
77
-
78
-
79
-
80
-
81
-
82
 |
 |

22
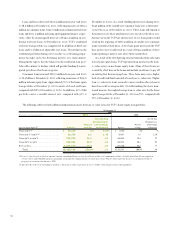
This financial review presents management’s discussion and analysis
of the consolidated financial condition and results of operations of
TCF Financial Corporation (“TCF” or the “Company”) and should
be read in conjunction with the consolidated financial statements
and other financial data beginning on page 44.
Corporate Profile
TCF is the national financial holding company of two federally char-
tered banks, TCF National Bank headquartered in Minnesota and
TCF National Bank Colorado. The Company has 375 banking offices
in Minnesota, Illinois, Michigan, Wisconsin, Colorado and Indiana.
Other affiliates provide leasing and equipment finance, mortgage
banking, discount brokerage and investment and insurance sales.
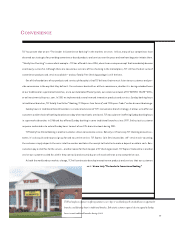
TCF provides convenient financial services through multiple
channels to customers located primarily in the Midwest. TCF has
developed products and services designed to meet the needs of all
consumers with a primary focus on middle- and lower-income indi-
viduals. The Company focuses on attracting and retaining customers
through service and convenience, including branches that are open
seven days a week and on most holidays, extensive full-service super-
market branch and automated teller machine (“ATM”) networks,
and telephone and Internet banking. TCF’s philosophy is to gener-
ate top-line revenue growth (net interest income and fees and other
revenues) through business lines that emphasize higher yielding assets
and lower interest-cost deposits. The Company’s growth strategies
include de novo branch expansion and the development of new prod-
ucts and services designed to build on its core businesses and expand
into complementary products and services through emerging busi-
nesses and strategic initiatives.
TCF’s core businesses are comprised of mature traditional bank
branches, EXPRESS TELLER ATMs, and commercial, consumer
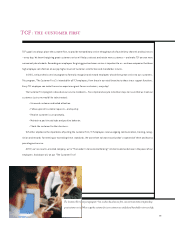
and mortgage lending. TCF emphasizes the “Totally Free” checking
account as its anchor account, which provides opportunities to cross
sell other convenience products and services and generate additional
fee income. TCF’s strategy is to originate high credit quality, pri-
marily secured loans and earn profits through lower interest-cost
deposits. Commercial loans are generally made on local properties
or to local customers, and are virtually all secured. TCF’s largest core
lending business is its consumer home equity loan portfolio, com-
prised of fixed- and variable-rate closed-end loans and lines of credit.
TCF’s emerging businesses and products are comprised of super-
market bank branches, including supermarket consumer lending,
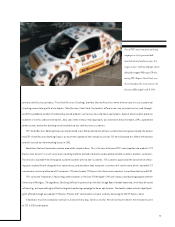
leasing and equipment finance, debit cards, and Internet and col-
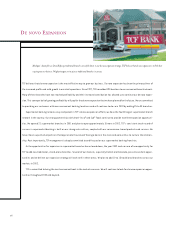
lege campus banking. TCF’s most significant de novo strategy has
been its supermarket branch expansion. The Company opened its
first supermarket branch in 1988, and now has 234 supermarket
branches, with more than $1.2 billion in deposits. TCF has the
nation’s fourth largest supermarket branch network. See “Financial
Condition – Deposits.” TCF entered the leasing business through its
1997 acquisition of Winthrop Resources Corporation (“Winthrop”),
a leasing company that leases computers and other business-essential
equipment to companies nationwide. The Company expanded its
leasing operations in September 1999 through TCF Leasing, Inc.
(“TCF Leasing”), a de novo general equipment leasing business to
serve the transportation, general middle-market equipment, lease
discounting, and syndication sectors. See “Financial Condition –
Loans and Leases.” The Company’s VISA®debit card program has
also grown significantly since its inception in 1996. According to a
September 30, 2001 statistical report issued by VISA, TCF is the 13th
largest VISA debit card issuer in the United States, with 1.2 million
cards outstanding and the 12th largest based on sales volume.
TCF’s strategic initiatives are businesses that complement the
Company’s core and emerging businesses. TCF’s new products have
been significant contributors to the growth in fees and other rev-
enues generated by checking accounts and loan products. Currently,
TCF’s strategic initiatives include continued investment in de novo
branch expansion, new loan and deposit products, including card
products, designed to provide additional convenience to deposit and
loan customers and to further leverage its EXPRESS TELLER ATM
network. In June 2001, the Company launched its discount broker-
age, TCF Express Trade, Inc. The Company is also planning to launch
additional insurance and investment products in 2002.
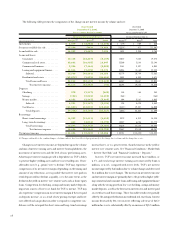
Results of Operations
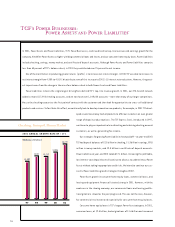
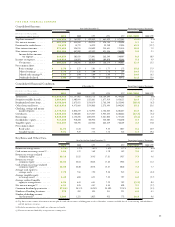
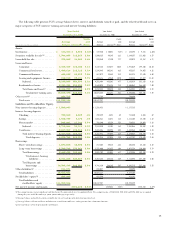
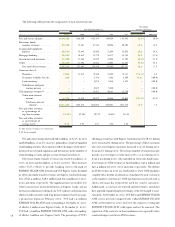
PERFORMANCE SUMMARY – TCF reported diluted earnings
per common share of $2.70 for 2001, compared with $2.35 for
2000 and $2.00 for 1999. Net income was $207.3 million for 2001,
up from $186.2 million for 2000 and $166 million for 1999. Return
on average assets was 1.79% in 2001, compared with 1.72% in 2000
and 1.61% in 1999. Return on average realized common equity was
23.18% in 2001, compared with 21.53% in 2000 and 19.83% in
1999. Diluted cash earnings per common share, which excludes amor-
tization of goodwill net of income tax benefits, was $2.80 for 2001,
compared with $2.44 for 2000 and $2.09 for 1999. On the same
basis, cash return on average assets was 1.86% for 2001, compared
with 1.79% for 2000 and 1.69% for 1999, and cash return on aver-
age realized common equity was 24.03% for 2001, compared with
22.40% for 2000 and 20.74% for 1999.
Financial Review