TCF Bank 2001 Annual Report Download - page 16
Download and view the complete annual report
Please find page 16 of the 2001 TCF Bank annual report below. You can navigate through the pages in the report by either clicking on the pages listed below, or by using the keyword search tool below to find specific information within the annual report.-
 1
1 -
2
-
3
-
4
-
5
-
 6
6 -
 7
7 -
 8
8 -
 9
9 -
 10
10 -
 11
11 -
 12
12 -
 13
13 -
 14
14 -
 15
15 -
 16
16 -
 17
17 -
 18
18 -
 19
19 -
 20
20 -
 21
21 -
 22
22 -
 23
23 -
 24
24 -
 25
25 -
 26
26 -
27
-
28
-
29
-
30
-
31
-
32
-
33
-
34
-
35
-
36
-
37
-
38
-
39
-
40
-
41
-
42
-
43
-
44
-
45
-
46
-
47
-
48
-
49
-
50
-
51
-
52
-
53
-
54
-
55
-
56
-
57
-
58
-
59
-
60
-
61
-
62
-
63
-
64
-
65
-
66
-
67
-
68
-
69
-
70
-
71
-
72
-
73
-
74
-
75
-
76
-
77
-
78
-
79
-
80
-
81
-
82
 |
 |

14
In 2001, Power Assets and Power Liabilities, TCF’s Power Businesses, continued to drive top-line revenues and earnings growth for the
company. We define Power Assets as higher-yielding commercial loans and leases, and our consumer home equity loans. Power Liabilities
include checking, savings, money market, and certificate of deposit accounts. Although Power Assets and Power Liabilities comprise
less than 60 percent of TCF’s balance sheet, in 2001 they contributed over 75 percent to net income.
One of the main factors in producing greater returns (profits) is to increase net interest margin. In 2001 TCF was able to increase its
net interest margin from 4.35% to 4.51%. We attribute some of this increase to 2001’s 11 interest rate reductions. However, the great-
est impact came from the change in the mix of our balance sheet in both Power Assets and Power Liabilities.
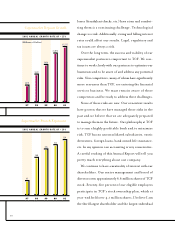
Power Liabilities remains the single largest driving force behind TCF’s top-line revenue growth. In 2001, our 375-branch network
added a record 117,900 checking accounts, and we now have over 1,249,000 accounts – more than many of our larger competitors.
We use the checking account as the first point of contact with the customer and then look for opportunities to cross-sell additional
products and services. To facilitate this effort, we continually look to develop innovative new products; for example, in 2001 TCF devel-
oped several new money market products to offer our customers an even greater
range of deposit product options. The TCF Express Card, introduced in 1997,
continues to play an important role in attracting and retaining checking account
customers, as well as generating fee income.
Our strategies for growing Power Liabilities have paid off – at year-end 2001
TCF had deposit balances of $2.5 billion in checking, $1.3 billion in savings, $951
million in money markets, and $2.3 billion in certificate of deposit accounts.
Power Liabilities at year-end 2001 totaled $7.1 billion. Increasing this profitable,
low interest-cost deposit base will continue to allow us to underwrite our Power
Assets without taking inappropriate credit risks. We intend to continue our suc-
cessful Power Liabilities growth strategies throughout 2002.
Power Asset growth in consumer home equity loans, commercial loans, and
leasing and equipment finance all started strong in 2001. However, with the
weakness in the slowing economy, our commercial loans and leasing portfo-
lio originations slowed as the year progressed. This was not the case, however,
for commercial real estate and especially for consumer home equity loans.
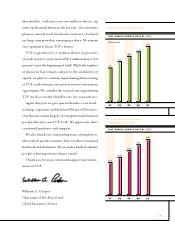
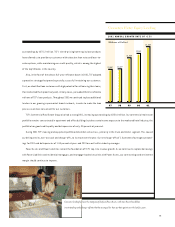
Consumer home equity loans is TCF’s largest Power Asset category. In 2001,
consumer loans, at $2.5 billion, had originations of $1.6 billion and increased
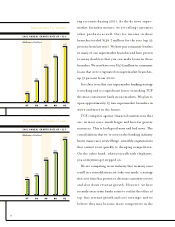
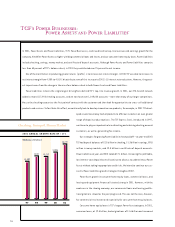
TCF’SPOWER BUSINESSES:
POWER ASSETS®AND POWER LIABILITIES®
2001 ANNUAL GROWTH RATE OF +17%
$3,302
$3,757 $3,712
$4,086
$4,779
97 98 99 00 01
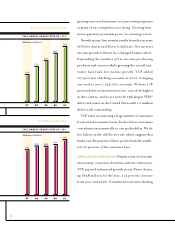
Checking, Savings & Money Market
(Millions of Dollars)