TCF Bank 2001 Annual Report Download - page 31
Download and view the complete annual report
Please find page 31 of the 2001 TCF Bank annual report below. You can navigate through the pages in the report by either clicking on the pages listed below, or by using the keyword search tool below to find specific information within the annual report.-
 1
1 -
2
-
3
-
4
-
5
-
6
-
7
-
8
-
9
-
10
-
11
-
12
-
13
-
14
-
15
-
16
-
17
-
18
-
19
-
20
-
 21
21 -
 22
22 -
 23
23 -
 24
24 -
 25
25 -
 26
26 -
 27
27 -
 28
28 -
 29
29 -
 30
30 -
 31
31 -
 32
32 -
 33
33 -
 34
34 -
 35
35 -
 36
36 -
 37
37 -
 38
38 -
 39
39 -
 40
40 -
 41
41 -
42
-
43
-
44
-
45
-
46
-
47
-
48
-
49
-
50
-
51
-
52
-
53
-
54
-
55
-
56
-
57
-
58
-
59
-
60
-
61
-
62
-
63
-
64
-
65
-
66
-
67
-
68
-
69
-
70
-
71
-
72
-
73
-
74
-
75
-
76
-
77
-
78
-
79
-
80
-
81
-
82
 |
 |

29
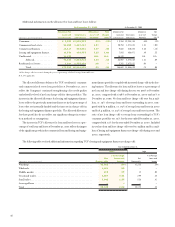
Mortgage banking revenues increased $1.5 million or 14.5% in
2001, following a decrease of $2.3 million or 17.6% in 2000. The
increase in revenues during 2001 is attributable to increased loan
origination and sale activity, partially offset by increased amortiza-
tion and impairment of mortgage service rights due to high levels
of actual and assumed prepayments and increased volumes. The
decrease in total mortgage banking revenues for 2000 was primar-
ily due to a decline in gains on sales of loans and net servicing income
due to lower levels of originations of mortgages and the related ser-
vicing rights. At December 31, 2001, 2000 and 1999, TCF was ser-
vicing mortgage loans for others with aggregate unpaid principal
balances of $4.7 billion, $4 billion and $2.9 billion, respectively.
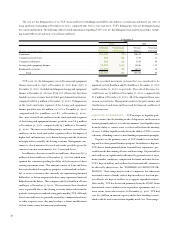
As noted above, mortgage banking revenues are impacted by the
amount of amortization and impairment of mortgage servicing rights.
The capitalization, amortization and impairment of mortgage servicing
rights are critical accounting policies to TCF and are subject to signif-
icant estimates. These estimates are based upon loan types, note rates
and prepayment assumptions for the overall portfolio. Changes in the
mix of loans, interest rates, defaults or prepayment speeds may have a
material effect on the amortization amount and possible impairment
in valuation. In a declining interest rate environment, prepayments
will increase and result in an acceleration in the amortization of the
mortgage servicing rights as the underlying portfolio declines and also
may result in impairment valuation charges as the value of the mortgage
servicing rights decline. TCF periodically evaluates its capitalized mort-
gage servicing rights for impairment. Any impairment is recognized
through a valuation allowance. See Notes 1 and 9 of Notes to
Consolidated Financial Statements for additional information con-
cerning TCF’s mortgage servicing rights.
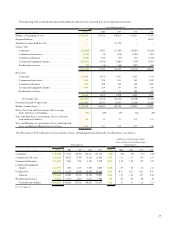
Leasing and equipment finance revenues increased $7.3 million,
or 19%, in 2001 to $45.7 million, following an increase of $9.9 mil-
lion or 34.9%, in 2000 to $38.4 million. The volume and type of
new lease transactions and the resulting revenues may fluctuate from
period to period based upon factors not within the control of TCF,
such as economic conditions. The increase in total leasing and equip-
ment finance revenues for 2001 is primarily due to increases of $3.6
million from sales-type lease transactions, $3.1 million from operat-
ing lease transactions and $644,000 in other revenues. The increase
in total leasing revenues for 2000 was primarily due to increased rev-
enue of $6.8 million from sales-type lease transactions and an increase
of $1.7 million in operating lease transactions. TCF’s ability to grow
its lease portfolio is dependent upon its ability to place new equip-
ment in service. In an adverse economic environment, there may be
a decline in the demand for some types of equipment which TCF
leases, resulting in a decline in the amount of new equipment being
placed into service.
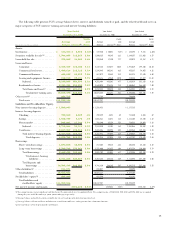
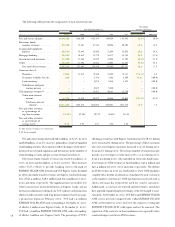
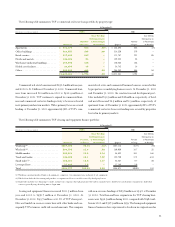
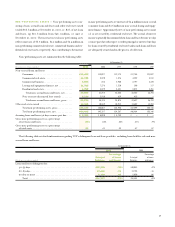
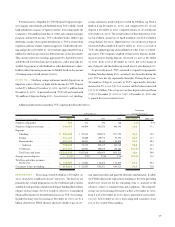
The following table sets forth information about mortgage banking revenues:
Percentage
Year Ended December 31, Increase (Decrease)
(Dollars in thousands) 2001 2000 1999 1998 1997 2001/2000 2000/1999
Servicing income. . . . . . . . . . . . . $16,932 $12,642 $12,981 $17,146 $17,093 33.9% (2.6)%
Less: Mortgage servicing
amortization and
impairment . . . . . . . . . . . . . . 20,964 5,326 4,906 6,814 4,853 N.M. 8.6
Net servicing
income (loss) . . . . . . . . (4,032) 7,316 8,075 10,332 12,240 N.M. (9.4)
Gains on sales of loans. . . . . . . . . 11,795 1,347 3,194 4,536 1,229 N.M. (57.8)
Other income. . . . . . . . . . . . . . . 4,279 1,856 1,501 2,009 299 130.5 23.7
Total mortgage banking . . . $12,042 $10,519 $12,770 $16,877 $13,768 14.5 (17.6)
N.M. Not meaningful.
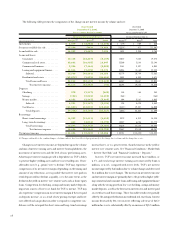
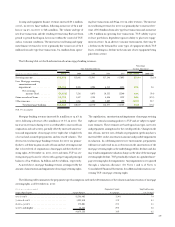
The following table summarizes the prepayment speed assumptions used in the determination of the valuation and amortization of mortgage
servicing rights as of December 31, 2001:
(Dollars in thousands) Prepayment Speed Weighted Average
Interest Rate Tranche Unpaid Balance Assumption Life (in Years)
0 to 7.00% . . . . . . . . . . . . . . . . . . . . . . . . . . . . $2,386,402 12.4% 7.4
7.01 to 8.00% . . . . . . . . . . . . . . . . . . . . . . . . . . 1,993,510 17.9 5.1
8.01 to 9.00% . . . . . . . . . . . . . . . . . . . . . . . . . . 275,001 27.8 3.1
9.01% and higher . . . . . . . . . . . . . . . . . . . . . . . . 24,442 29.4 2.6
$4,679,355 14.9 6.2