TCF Bank 2001 Annual Report Download - page 27
Download and view the complete annual report
Please find page 27 of the 2001 TCF Bank annual report below. You can navigate through the pages in the report by either clicking on the pages listed below, or by using the keyword search tool below to find specific information within the annual report.-
 1
1 -
2
-
3
-
4
-
5
-
6
-
7
-
8
-
9
-
10
-
11
-
12
-
13
-
14
-
15
-
16
-
 17
17 -
 18
18 -
 19
19 -
 20
20 -
 21
21 -
 22
22 -
 23
23 -
 24
24 -
 25
25 -
 26
26 -
 27
27 -
 28
28 -
 29
29 -
 30
30 -
 31
31 -
 32
32 -
 33
33 -
 34
34 -
 35
35 -
 36
36 -
 37
37 -
38
-
39
-
40
-
41
-
42
-
43
-
44
-
45
-
46
-
47
-
48
-
49
-
50
-
51
-
52
-
53
-
54
-
55
-
56
-
57
-
58
-
59
-
60
-
61
-
62
-
63
-
64
-
65
-
66
-
67
-
68
-
69
-
70
-
71
-
72
-
73
-
74
-
75
-
76
-
77
-
78
-
79
-
80
-
81
-
82
 |
 |

25
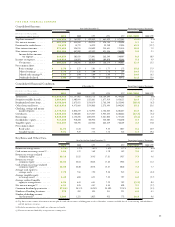
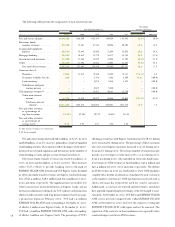
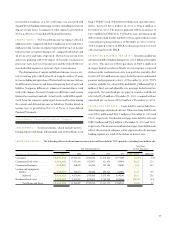
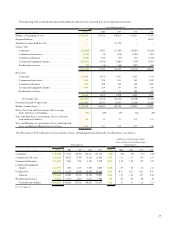
The following table presents TCF’s average balance sheets, interest and dividends earned or paid, and the related yields and rates on
major categories of TCF’s interest-earning assets and interest-bearing liabilities:
Year Ended Year Ended Year Ended
December 31, 2001 December 31, 2000 December 31, 1999
Yields Yields Yields
Average and Average and Average and
(Dollars in thousands) Balance Interest(1) Rates Balance Interest(1) Rates Balance Interest(1) Rates
Assets:
Investments . . . . . . . . . . . . . . . . . . . $ 164,362 $ 8,966 5.46% $ 139,840 $ 10,041 7.18% $ 142,494 $ 9,411 6.60%
Securities available for sale(2). . . . . . . 1,706,093 112,267 6.58 1,500,225 99,185 6.61 1,689,257 111,032 6.57
Loans held for sale . . . . . . . . . . . . . . 379,045 24,266 6.40 220,560 17,130 7.77 199,073 13,367 6.71
Loans and leases:
Consumer . . . . . . . . . . . . . . . . . 2,346,349 215,438 9.18 2,139,135 218,577 10.22 1,971,069 199,103 10.10
Commercial real estate. . . . . . . . . 1,490,616 116,128 7.79 1,195,985 103,181 8.63 933,227 78,033 8.36
Commercial business . . . . . . . . . . 409,685 29,893 7.30 367,072 33,483 9.12 341,378 27,425 8.03
Leasing and equipment finance . . 918,915 89,131 9.70 650,616 69,960 10.75 410,245 47,077 11.48
Subtotal. . . . . . . . . . . . . . . . . 5,165,565 450,590 8.72 4,352,808 425,201 9.77 3,655,919 351,638 9.62
Residential real estate. . . . . . . . . . 3,251,328 230,520 7.09 3,860,025 275,124 7.13 3,808,062 266,653 7.00
Total loans and leases(3) . . . . . 8,416,893 681,110 8.09 8,212,833 700,325 8.53 7,463,981 618,291 8.28
Total interest-earning assets. . 10,666,393 826,609 7.75 10,073,458 826,681 8.21 9,494,805 752,101 7.92
Other assets(4) . . . . . . . . . . . . . . . . . 886,713 773,799 798,494
Total assets . . . . . . . . . . . . . . . . . $11,553,106 $10,847,257 $10,293,299
Liabilities and Stockholders’ Equity:
Non-interest bearing deposits . . . . . . $ 1,580,907 $ 1,328,932 $ 1,177,723
Interest-bearing deposits:
Checking . . . . . . . . . . . . . . . . . . 790,023 3,549 .45 739,429 4,391 .59 711,440 4,043 .57
Savings . . . . . . . . . . . . . . . . . . . . 1,018,730 7,472 .73 1,036,861 11,571 1.12 1,111,104 12,435 1.12
Money market . . . . . . . . . . . . . . . 902,091 21,144 2.34 758,240 25,139 3.32 728,522 19,074 2.62
Subtotal. . . . . . . . . . . . . . . . . 2,710,844 32,165 1.19 2,534,530 41,101 1.62 2,551,066 35,552 1.39
Certificates . . . . . . . . . . . . . . . . . 2,607,009 130,562 5.01 2,824,456 155,993 5.52 2,888,968 139,943 4.84
Total interest-bearing deposits . . 5,317,853 162,727 3.06 5,358,986 197,094 3.68 5,440,034 175,495 3.23
Total deposits . . . . . . . . . . 6,898,760 162,727 2.36 6,687,918 197,094 2.95 6,617,757 175,495 2.65
Borrowings:
Short-term borrowings . . . . . . . . 1,097,688 44,800 4.08 767,302 49,218 6.41 601,224 32,333 5.38
Long-term borrowings . . . . . . . . 2,345,742 137,860 5.88 2,331,400 141,833 6.08 2,072,734 120,060 5.79
Total borrowings . . . . . . . . . . 3,443,430 182,660 5.30 3,098,702 191,051 6.17 2,673,958 152,393 5.70
Total interest-bearing
liabilities . . . . . . . . . . . 8,761,283 345,387 3.94 8,457,688 388,145 4.59 8,113,992 327,888 4.04
Total deposits and
borrowings . . . . . . . . . . . . 10,342,190 345,387 3.34 9,786,620 388,145 3.97 9,291,715 327,888 3.53
Other liabilities(4) . . . . . . . . . . . . . . 311,871 238,047 185,393
Total liabilities . . . . . . . . . . . . . . 10,654,061 10,024,667 9,477,108
Stockholders’ equity(4) . . . . . . . . . . . 899,045 822,590 816,191
Total liabilities and
stockholders’ equity . . . . . . . . $11,553,106 $10,847,257 $10,293,299
Net interest income and margin . . . . $481,222 4.51% $438,536 4.35% $424,213 4.47%
(1)Tax-exempt income was not significant and thus has not been presented on a tax equivalent basis. Tax-exempt income of $156,000, $181,000 and $189,000 was recognized
during the years ended December 31, 2001, 2000 and 1999, respectively.
(2)Average balance and yield of securities available for sale are based upon the historical amortized cost.
(3) Average balance of loans and leases includes non-accrual loans and leases, and is presented net of unearned income.
(4) Average balance is based upon month-end balances.