TCF Bank 2001 Annual Report Download - page 38
Download and view the complete annual report
Please find page 38 of the 2001 TCF Bank annual report below. You can navigate through the pages in the report by either clicking on the pages listed below, or by using the keyword search tool below to find specific information within the annual report.-
 1
1 -
2
-
3
-
4
-
5
-
6
-
7
-
8
-
9
-
10
-
11
-
12
-
13
-
14
-
15
-
16
-
17
-
18
-
19
-
20
-
21
-
22
-
23
-
24
-
25
-
26
-
27
-
 28
28 -
 29
29 -
 30
30 -
 31
31 -
 32
32 -
 33
33 -
 34
34 -
 35
35 -
 36
36 -
 37
37 -
 38
38 -
 39
39 -
 40
40 -
 41
41 -
 42
42 -
 43
43 -
 44
44 -
 45
45 -
 46
46 -
 47
47 -
 48
48 -
49
-
50
-
51
-
52
-
53
-
54
-
55
-
56
-
57
-
58
-
59
-
60
-
61
-
62
-
63
-
64
-
65
-
66
-
67
-
68
-
69
-
70
-
71
-
72
-
73
-
74
-
75
-
76
-
77
-
78
-
79
-
80
-
81
-
82
 |
 |

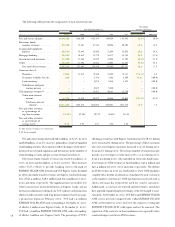
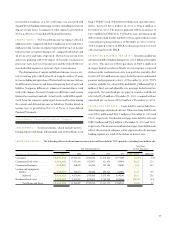
The allocated allowance balances for TCF’s residential, consumer
and commercial real estate loan portfolios at December 31, 2001
reflect the Company’s continued strengthening of its credit quality
and related low level of net loan charge-offs for these portfolios. The
increase in the allocated allowance for leasing and equipment finance
losses reflects the previously mentioned increase in the percentage of
leases that are internally funded and the increase in charge-offs in
the leasing and equipment finance portfolio. The allocated allowances
for these portfolios do not reflect any significant changes in estima-
tion methods or assumptions.
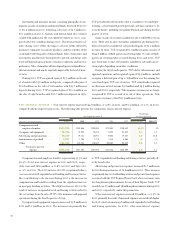
The increase in TCF’s allowance for loan and lease losses as a per-
centage of total loans and leases at December 31, 2001 reflects the impact
of the significant growth in the commercial loan and leasing and equip-
ment finance portfolios coupled with increased charge-offs in the leas-
ing business. The allowance for loan and lease losses as a percentage of
net loan and lease charge-offs during the year was 599% at December
31, 2001, compared with 1,728% at December 31, 2000 and 211% at
December 31, 1999. Net loan and lease charge-offs were $12.5 mil-
lion, or .15% of average loans and leases outstanding in 2001, com-
pared with $3.9 million, or .05% of average loans and leases in 2000
and $26.4 million, or .35% of average loans and leases in 1999. The
ratio of net loan charge-offs to average loans outstanding for TCF’s
consumer portfolio was .13% for the year ended December 31, 2001,
compared with .12% for the year ended December 31, 2000. Included
in total net loan and lease charge-offs were $9.1 million and $2.2 mil-
lion of leasing and equipment finance net charge-offs during 2001 and
2000, respectively.
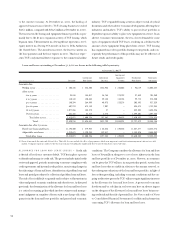
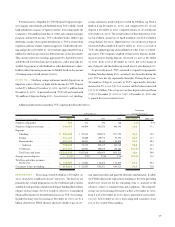
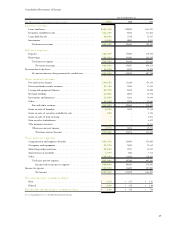
Additional information on the allowance for loan and lease losses follows:
At December 31, 2001 At December 31, 2000
Allowance for Allowance Net Allowance for Allowance Net
Loan and Total Loans as a % of Charge Loan and Total Loans as a % of Charge
(Dollars in thousands) Lease Losses and Leases Portfolio Offs(1) Lease Losses and Leases Portfolio Offs(1)
Consumer . . . . . . . . . . . . . . . . $ 8,355 $2,509,333 .33% .13% $ 9,764 $2,234,134 .44% .12%
Commercial real estate . . . . . . . 24,459 1,622,461 1.51 – 20,753 1,371,841 1.51 (.02)
Commercial business . . . . . . . . 12,117 422,381 2.87 .06 9,668 410,422 2.36 (.15)
Leasing and equipment finance . . 11,774 956,737 1.23 1.00 7,583 856,471 .89 .33
Unallocated . . . . . . . . . . . . . . . 16,139 – N.A. N.A. 16,139 – N.A. N.A.
Subtotal. . . . . . . . . . . . . 72,844 5,510,912 1.32 .24 63,907 4,872,868 1.31 .09
Residential real estate . . . . . . . . 2,184 2,733,290 .08 – 2,762 3,673,831 .08 –
Total . . . . . . . . . . . . . . . $75,028 $8,244,202 .91 .15 $66,669 $8,546,699 .78 .05
(1) Net charge-offs (recoveries) during the year as a percentage of related average loans and leases.
N.A. Not applicable.
36
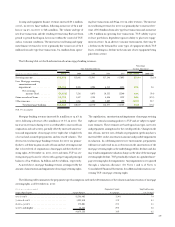
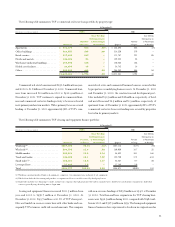
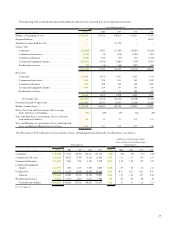
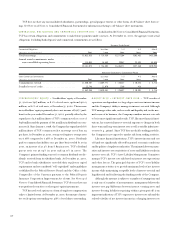
The following table sets forth additional information regarding TCF’s leasing and equipment finance net charge-offs:
Year Ended December 31,
2001 2000
2
% of Average % of Average
Net Loans and Net Loans and
(Dollars in thousands) Charge-offs Leases Charge-offs Leases
Winthrop . . . . . . . . . . . . . . . . . . . . . . . . . . . . . . . . . . . . . . . . . . . . . . $2,182 .64% $1,325 .38%
Wholesale . . . . . . . . . . . . . . . . . . . . . . . . . . . . . . . . . . . . . . . . . . . . . . 1,621 .85 ––
Middle market. . . . . . . . . . . . . . . . . . . . . . . . . . . . . . . . . . . . . . . . . . . 513 .39 12 .03
Truck and trailer . . . . . . . . . . . . . . . . . . . . . . . . . . . . . . . . . . . . . . . . . 3,587 2.31 299 .32
Small ticket . . . . . . . . . . . . . . . . . . . . . . . . . . . . . . . . . . . . . . . . . . . . . 1,242 1.37 536 .81
Leveraged lease . . . . . . . . . . . . . . . . . . . . . . . . . . . . . . . . . . . . . . . . . . –– ––
Total . . . . . . . . . . . . . . . . . . . . . . . . . . . . . . . . . . . . . . . . . . . . . . . . . $9,145 1.00 $2,172 .33