TCF Bank 2001 Annual Report Download - page 62
Download and view the complete annual report
Please find page 62 of the 2001 TCF Bank annual report below. You can navigate through the pages in the report by either clicking on the pages listed below, or by using the keyword search tool below to find specific information within the annual report.-
 1
1 -
2
-
3
-
4
-
5
-
6
-
7
-
8
-
9
-
10
-
11
-
12
-
13
-
14
-
15
-
16
-
17
-
18
-
19
-
20
-
21
-
22
-
23
-
24
-
25
-
26
-
27
-
28
-
29
-
30
-
31
-
32
-
33
-
34
-
35
-
36
-
37
-
38
-
39
-
40
-
41
-
42
-
43
-
44
-
45
-
46
-
47
-
48
-
49
-
50
-
51
-
 52
52 -
 53
53 -
 54
54 -
 55
55 -
 56
56 -
 57
57 -
 58
58 -
 59
59 -
 60
60 -
 61
61 -
 62
62 -
 63
63 -
 64
64 -
 65
65 -
 66
66 -
 67
67 -
 68
68 -
 69
69 -
 70
70 -
 71
71 -
 72
72 -
73
-
74
-
75
-
76
-
77
-
78
-
79
-
80
-
81
-
82
 |
 |

60
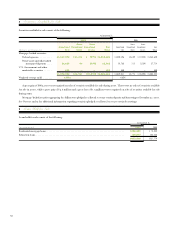
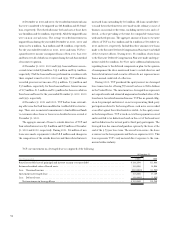
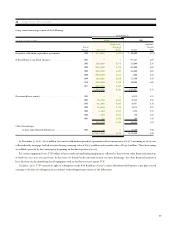
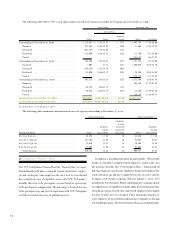
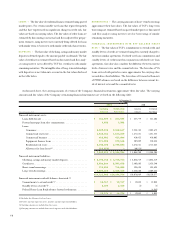
Included in FHLB advances at December 31, 2001 are $1.3 billion of fixed-rate advances which are callable at par on certain dates. If called,
the FHLB will provide replacement funding at the then-prevailing market interest rates. Due to changes in interest rates since the long-term
FHLB advances were obtained, the market rate exceeded the contract rates on $5.5 million of long-term advances with call dates within one
year. The probability that these advances will be called depends primarily on the level of related interest rates during the call period. The stated
maturity dates and the next call dates for the callable FHLB advances outstanding at December 31, 2001 were as follows (dollars in thousands):
Weighted– Weighted-
Year Stated Maturity Average Rate Next Call Date Average Rate
2002. . . . . . . . . . . . . . . . . . . . . . . . . . . . . . . . . . . . . . . . . . . . . . . $ – –% $ 642,500 5.67%
2003. . . . . . . . . . . . . . . . . . . . . . . . . . . . . . . . . . . . . . . . . . . . . . . 85,000 5.65 300,000 5.68
2004. . . . . . . . . . . . . . . . . . . . . . . . . . . . . . . . . . . . . . . . . . . . . . . 303,000 5.49 317,000 4.93
2005. . . . . . . . . . . . . . . . . . . . . . . . . . . . . . . . . . . . . . . . . . . . . . . 246,000 5.92 – –
2006. . . . . . . . . . . . . . . . . . . . . . . . . . . . . . . . . . . . . . . . . . . . . . . 203,000 5.55 – –
2009. . . . . . . . . . . . . . . . . . . . . . . . . . . . . . . . . . . . . . . . . . . . . . . 122,500 5.16 – –
2010 . . . . . . . . . . . . . . . . . . . . . . . . . . . . . . . . . . . . . . . . . . . . . . . 100,000 5.92 – –
2011 . . . . . . . . . . . . . . . . . . . . . . . . . . . . . . . . . . . . . . . . . . . . . . . 200,000 4.78 – –
$1,259,500 5.49 $1,259,500 5.49
FHLB advances are collateralized by residential real estate loans and FHLB stock with an aggregate carrying value of $2.5 billion at
December 31, 2001.
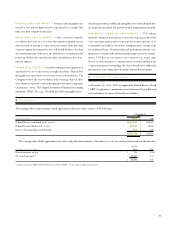
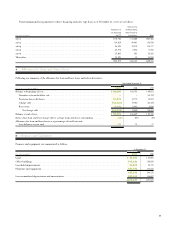
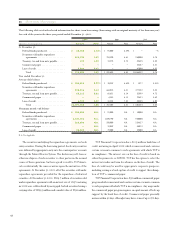
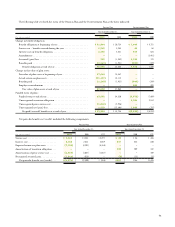
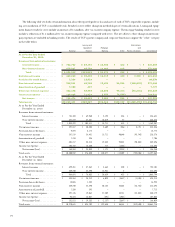
13 Income Taxes
Income tax expense consists of:
(In thousands) Current Deferred Total
Year ended December 31, 2001:
Federal . . . . . . . . . . . . . . . . . . . . . . . . . . . . . . . . . . . . . . . . . . . . . . . . . . . . . . . $112,288 $3,707 $115,995
State . . . . . . . . . . . . . . . . . . . . . . . . . . . . . . . . . . . . . . . . . . . . . . . . . . . . . . . . . 6,188 329 6,517
$118,476 $4,036 $122,512
Year ended December 31, 2000:
Federal . . . . . . . . . . . . . . . . . . . . . . . . . . . . . . . . . . . . . . . . . . . . . . . . . . . . . . . . $ 88,746 $ 18,862 $ 107,608
State . . . . . . . . . . . . . . . . . . . . . . . . . . . . . . . . . . . . . . . . . . . . . . . . . . . . . . . . . . 6,457 2,528 8,985
$ 95,203 $ 21,390 $ 116,593
Year ended December 31, 1999:
Federal . . . . . . . . . . . . . . . . . . . . . . . . . . . . . . . . . . . . . . . . . . . . . . . . . . . . . . . . $ 91,647 $ 2,981 $ 94,628
State . . . . . . . . . . . . . . . . . . . . . . . . . . . . . . . . . . . . . . . . . . . . . . . . . . . . . . . . . . 11,747 677 12,424
$ 103,394 $ 3,658 $ 107,052
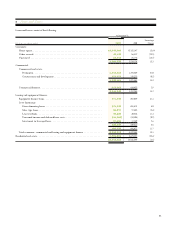
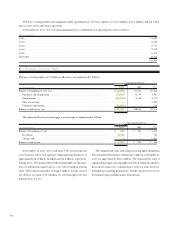
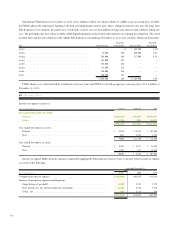
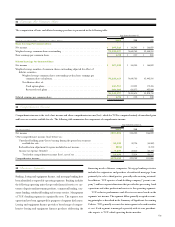
Income tax expense differs from the amounts computed by applying the federal income tax rate of 35% to income before income tax expense
as a result of the following:
Year Ended December 31,
(In thousands) 2001 2000 1999
Computed income tax expense. . . . . . . . . . . . . . . . . . . . . . . . . . . . . . . . . . . . . . . . . . $115,442 $105,993 $ 95,582
Increase in income tax expense resulting from:
Amortization of goodwill . . . . . . . . . . . . . . . . . . . . . . . . . . . . . . . . . . . . . . . . . . . 2,553 2,544 2,724
State income tax, net of federal income tax benefit . . . . . . . . . . . . . . . . . . . . . . . . . 4,236 5,840 8,076
Other, net . . . . . . . . . . . . . . . . . . . . . . . . . . . . . . . . . . . . . . . . . . . . . . . . . . . . . 281 2,216 670
$122,512 $116,593 $107,052