TCF Bank 2001 Annual Report Download - page 34
Download and view the complete annual report
Please find page 34 of the 2001 TCF Bank annual report below. You can navigate through the pages in the report by either clicking on the pages listed below, or by using the keyword search tool below to find specific information within the annual report.-
 1
1 -
2
-
3
-
4
-
5
-
6
-
7
-
8
-
9
-
10
-
11
-
12
-
13
-
14
-
15
-
16
-
17
-
18
-
19
-
20
-
21
-
22
-
23
-
 24
24 -
 25
25 -
 26
26 -
 27
27 -
 28
28 -
 29
29 -
 30
30 -
 31
31 -
 32
32 -
 33
33 -
 34
34 -
 35
35 -
 36
36 -
 37
37 -
 38
38 -
 39
39 -
 40
40 -
 41
41 -
 42
42 -
 43
43 -
 44
44 -
45
-
46
-
47
-
48
-
49
-
50
-
51
-
52
-
53
-
54
-
55
-
56
-
57
-
58
-
59
-
60
-
61
-
62
-
63
-
64
-
65
-
66
-
67
-
68
-
69
-
70
-
71
-
72
-
73
-
74
-
75
-
76
-
77
-
78
-
79
-
80
-
81
-
82
 |
 |

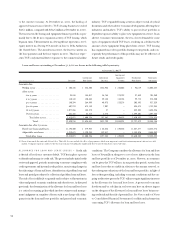
Loans and leases decreased $302.5 million from year-end 2000
to $8.2 billion at December 31, 2001, reflecting increases of $275.2
million in consumer loans, $250.6 million in commercial real estate
loans and $100.3 million in leasing and equipment finance, respec-
tively, offset by an anticipated decrease of $940.5 million in resi-
dential real estate loans. At December 31, 2001, TCF’s residential
real estate loan portfolio was comprised of $1.5 billion of fixed-rate
loans and $1.2 billion of adjustable-rate loans. The decline in the
residential portfolio during 2001 was due to accelerating prepay-
ments brought on by the declining interest rate environment.
Management expects that the balance in the residential loan port-
folio will continue to decline, which will provide funding for antic-
ipated growth in other loan categories.
Consumer loans increased $275.2 million from year-end 2000
to $2.5 billion at December 31, 2001, reflecting an increase of $291.6
million in home equity loans. Approximately 70% of the home equity
loan portfolio at December 31, 2001 consists of closed-end loans,
compared with 68% at December 31, 2000. In addition, 51% of this
portfolio carries a variable interest rate, compared with 47% at
December 31, 2000. As a result of falling interest rates during 2001,
$946 million of the variable rate consumer loans were at their inter-
est rate floors as of December 31, 2001. These loans will remain at
their interest rate floor until interest rates rise above the floor rate.
An increase in the TCF base interest rate of 100 basis points would
result in the repricing of $366.9 million of variable rate consumer
loans currently at their floor. A 200 basis point increase in the TCF
base interest rate would result in a total of $654.5 million of these
loans repricing at interest rates above their current floor.
As a result of the tiered pricing structure introduced in early 1999
for its home equity loans, TCF experienced an increase in the loan-
to-value ratios on new home equity loans. Many of these loans are
secured by a first lien on the home and include an advance to pay off
an existing first lien mortgage loan. These loans may carry a higher
level of credit risk than loans with a lower loan-to-value ratio. Higher
loan-to-value ratio loans are made to more creditworthy customers
based on credit scoring models. Notwithstanding the above men-
tioned increase, the weighted average loan-to-value ratio for the home
equity loan portfolio at December 31, 2001 was 72%, compared with
77% at December 31, 2000.
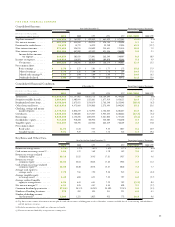
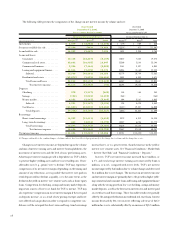
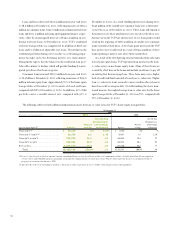
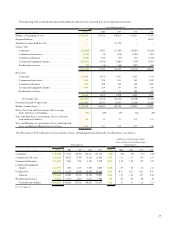
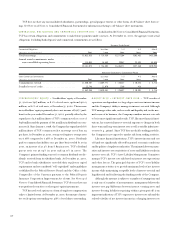
The following table sets forth additional information about the loan-to-value ratios for TCF’s home equity loan portfolio:
At December 31,
(Dollars in thousands) 2001 2000
2
Over 30-Day Over 30-Day
Delinquency as Delinquency as
Percent a Percentage Percent a Percentage
Loan-to-Value Ratios(1) Balance of Total of Portfolio Balance of Total of Portfolio
Over 105%(2) . . . . . . . . . . . . . . . . . . . $ 10,203 .4% 2.69% $ 5,766 .3% –%
Over 100%-105%(2) . . . . . . . . . . . . . . 56,375 2.3 1.43 39,867 1.8 2.10
Over 90% to 100% . . . . . . . . . . . . . . . 396,333 16.2 .69 486,536 22.6 .97
Over 80% to 90% . . . . . . . . . . . . . . . . 802,094 32.8 .64 648,218 30.1 .93
80% or less . . . . . . . . . . . . . . . . . . . . . 1,178,783 48.3 .69 971,760 45.2 .77
Total . . . . . . . . . . . . . . . . . . . . . . . $2,443,788 100.0% .70 $2,152,147 100.0% .89
(1) Loan-to-value is based on the loan amount (current outstanding balance on closed-end loans and the total commitment on lines of credit) plus deferred loan origination
costs net of fees and refundable insurance premiums, if any, plus the original amount of senior liens, if any. Property values represent the most recent appraised value or
property tax assessment value known to TCF.
(2)Amount reflects the total outstanding loan balance. The portion of the loan balance in excess of 100% of the property value is substantially less.
32