TCF Bank 2001 Annual Report Download - page 30
Download and view the complete annual report
Please find page 30 of the 2001 TCF Bank annual report below. You can navigate through the pages in the report by either clicking on the pages listed below, or by using the keyword search tool below to find specific information within the annual report.-
 1
1 -
2
-
3
-
4
-
5
-
6
-
7
-
8
-
9
-
10
-
11
-
12
-
13
-
14
-
15
-
16
-
17
-
18
-
19
-
 20
20 -
 21
21 -
 22
22 -
 23
23 -
 24
24 -
 25
25 -
 26
26 -
 27
27 -
 28
28 -
 29
29 -
 30
30 -
 31
31 -
 32
32 -
 33
33 -
 34
34 -
 35
35 -
 36
36 -
 37
37 -
 38
38 -
 39
39 -
 40
40 -
41
-
42
-
43
-
44
-
45
-
46
-
47
-
48
-
49
-
50
-
51
-
52
-
53
-
54
-
55
-
56
-
57
-
58
-
59
-
60
-
61
-
62
-
63
-
64
-
65
-
66
-
67
-
68
-
69
-
70
-
71
-
72
-
73
-
74
-
75
-
76
-
77
-
78
-
79
-
80
-
81
-
82
 |
 |

28
Fees and service charges increased $28.1 million, or 16.9%, in 2001
and $28 million, or 20.3%, in 2000, primarily as a result of expanded
retail banking activities. These increases reflect the impact of the invest-
ment in de novo branch expansion and the increase in the number of
retail checking accounts and per account revenues noted above.
Electronic funds transfer revenues increased $9 million, or
11.6%, in 2001 and $11 million, or 16.3%, in 2000. These increases
reflect TCF’s efforts to provide banking services through its
EXPRESS TELLER ATM network and TCF Express Cards. Included
in electronic funds transfer revenues are Express Card interchange
fees of $37.4 million, $28.7 million and $19.5 million for 2001,
2000 and 1999, respectively. The significant increase in these fees
reflects an increase in the distribution of Express Cards, and an
increase in utilization resulting from TCF’s phone card promotion
which rewards customers with long distance minutes based on usage,
a promotion begun in February 2000. TCF had 1.4 million
EXPRESS TELLER ATM cards outstanding at December 31, 2001,
of which 1.2 million were Express Cards. At December 31, 2000,
TCF had 1.2 million EXPRESS TELLER ATM cards outstanding,
of which 1.1 million were Express Cards. The percentage of TCF’s
checking account base with Express Cards increased to 78.3% during
2001, from 74.8% during 2000. The percentage of these customers
who were active Express Card users increased to 51.3% during 2001,
from 49.3% during 2000. The average number of transactions per
month on active Express Cards increased to 10.92 during 2001,
from 9.99 during 2000. Also included in electronic funds trans-
fer revenues are ATM revenues of $45.8 million, $47.3 million and
$46.4 million for 2001, 2000 and 1999, respectively. The decline
in ATM revenues in 2001 was attributable to fewer ATM machines
coupled with a decline in utilization of machines by non-customers
as the number of alternative ATM machines has increased and as
check card usage has reduced the need for cash by customers.
Additionally, as contracts are renewed and entered into, merchants
have generally required larger percentages of the fee charged to non-
customers. At December 31, 2001, TCF had 1,341 EXPRESS TELLER
ATM’s in its network compared with 1,384 EXPRESS TELLER
ATM’s at December 31, 2000. In 2002, the contracts covering 256
EXPRESS TELLER ATM’s will expire and not be renewed. The
expiration of the contracts on these machines is not expected to have
a material impact on future ATM revenues.
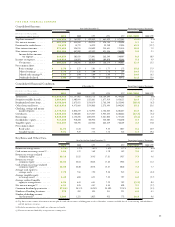
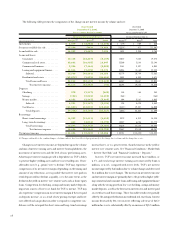
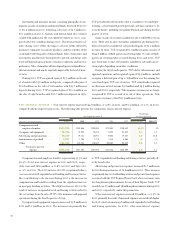
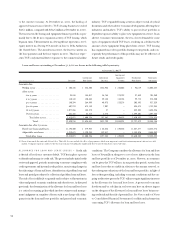
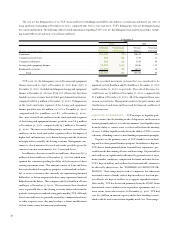
The following table presents the components of non-interest income:
Percentage
Year Ended December 31, Increase (Decrease)
(Dollars in thousands) 2001 2000 1999 1998 1997 2001/2000 2000/1999
Fees and service charges . . . . . . . $194,321 $166,240 $138,198 $109,934 $ 83,993 16.9% 20.3%
Electronic funds
transfer revenues . . . . . . . . . 87,134 78,101 67,144 50,556 30,808 11.6 16.3
Leasing and equipment
finance . . . . . . . . . . . . . . . . 45,730 38,442 28,505 31,344 32,025 19.0 34.9
Mortgage banking . . . . . . . . . . . 12,042 10,519 12,770 16,877 13,768 14.5 (17.6)
Investments and insurance. . . . . 11,535 12,266 14,849 13,926 11,892 (6.0) (17.4)
Other . . . . . . . . . . . . . . . . . . . 16,545 17,895 12,854 13,058 11,281 (7.5) 39.2
Fees and other revenues . . . . 367,307 323,463 274,320 235,695 183,767 13.6 17.9
Gains on sales of:
Branches. . . . . . . . . . . . . . . 3,316 12,813 12,160 18,585 14,187 (74.1) 5.4
Securities available for sale. . 863 – 3,194 2,246 8,509 N.M. (100.0)
Loan servicing . . . . . . . . . . . –– 3,076 2,414 1,622 – (100.0)
Subsidiaries and joint
venture interest . . . . . . . –– 5,522 5,580 – –(100.0)
Title insurance revenues(1) . . . . . –– 15,421 20,161 13,730 –(100.0)
Other non-interest
income . . . . . . . . . . . . . 4,179 12,813 39,373 48,986 38,048 (67.4) (67.5)
Total non-interest
income . . . . . . . . . . . $371,486 $336,276 $313,693 $284,681 $221,815 10.5 7.2
Fees and other revenues
as a percentage of
top-line revenues. . . . . . . . . 43.29% 42.45% 39.27% 35.63% 31.83%
Fees and other revenues
as a percentage of
average assets . . . . . . . . . . . . 3.18 2.98 2.67 2.45 2.25
(1) Title insurance business was sold in 1999.
N.M. Not meaningful.