TCF Bank 2001 Annual Report Download - page 17
Download and view the complete annual report
Please find page 17 of the 2001 TCF Bank annual report below. You can navigate through the pages in the report by either clicking on the pages listed below, or by using the keyword search tool below to find specific information within the annual report.-
 1
1 -
2
-
3
-
4
-
5
-
6
-
 7
7 -
 8
8 -
 9
9 -
 10
10 -
 11
11 -
 12
12 -
 13
13 -
 14
14 -
 15
15 -
 16
16 -
 17
17 -
 18
18 -
 19
19 -
 20
20 -
 21
21 -
 22
22 -
 23
23 -
 24
24 -
 25
25 -
 26
26 -
 27
27 -
28
-
29
-
30
-
31
-
32
-
33
-
34
-
35
-
36
-
37
-
38
-
39
-
40
-
41
-
42
-
43
-
44
-
45
-
46
-
47
-
48
-
49
-
50
-
51
-
52
-
53
-
54
-
55
-
56
-
57
-
58
-
59
-
60
-
61
-
62
-
63
-
64
-
65
-
66
-
67
-
68
-
69
-
70
-
71
-
72
-
73
-
74
-
75
-
76
-
77
-
78
-
79
-
80
-
81
-
82
 |
 |

15
outstandings by $275.2 million. TCF’s tiered-pricing home equity loan products
have allowed us to provide our customers with attractive loan rates and loan-to-
value options, while maintaining our credit quality, which is among the highest
of the top 50 banks in the country.
Also, in the face of the almost full-year refinance boom in 2001, TCF adopted
a proactive strategy that proved especially successful in retaining our customers.
First, we identified loan customers with high potential for refinancing their loans,
then contacted them proactively and, in many cases, persuaded them to refinance
with one of TCF’s loan products. Throughout 2001 we continued to place additional
lenders in our growing supermarket branch network, in order to make the loan
process even more convenient for our customers.
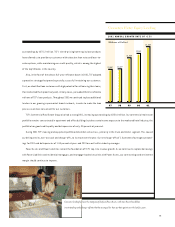
TCF’s Commercial Real Estate Group also had a strong 2001, increasing outstandings by $250.6 million. Our commercial real estate
portfolio remains concentrated in apartment and office buildings but does contain some exposure to the weakened hotel industry; the
portfolio has good credit quality and delinquencies of only .03 percent at year end.
During 2001 TCF’s leasing and equipment portfolio did exhibit some stress, primarily in the truck and trailer segment. This caused
our delinquencies, non-accruals and charge-offs, to increase over the year. Our net charge-offs of 1.0 percent of average outstand-
ings for 2001 and delinquencies of 1.84 percent at year-end 2001 are well within industry averages.
Power Assets and Power Liabilities remain the foundation of TCF’s top-line revenue growth. As we continue to replace borrowings
with Power Liabilities and residential mortgages, and mortgage-backed securities with Power Assets, our core earnings and net interest
margin should continue to improve.
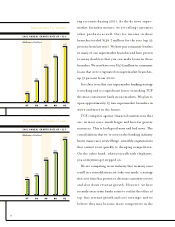
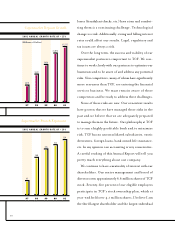
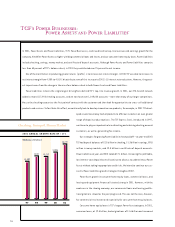
2001 ANNUAL GROWTH RATE OF +13%
(Millions of Dollars)
$1,457 $1,477
$1,959
$2,152
$2,444
97 98 99 00 01
Consumer Home Equity Lending
Consumer lending has been the most powerful of our Power Assets, with more than $2.5 billion
in outstandings and a charge-off rate that has averaged less than 20 basis points over the last five years.