TCF Bank 2001 Annual Report Download - page 42
Download and view the complete annual report
Please find page 42 of the 2001 TCF Bank annual report below. You can navigate through the pages in the report by either clicking on the pages listed below, or by using the keyword search tool below to find specific information within the annual report.-
 1
1 -
2
-
3
-
4
-
5
-
6
-
7
-
8
-
9
-
10
-
11
-
12
-
13
-
14
-
15
-
16
-
17
-
18
-
19
-
20
-
21
-
22
-
23
-
24
-
25
-
26
-
27
-
28
-
29
-
30
-
31
-
 32
32 -
 33
33 -
 34
34 -
 35
35 -
 36
36 -
 37
37 -
 38
38 -
 39
39 -
 40
40 -
 41
41 -
 42
42 -
 43
43 -
 44
44 -
 45
45 -
 46
46 -
 47
47 -
 48
48 -
 49
49 -
 50
50 -
 51
51 -
 52
52 -
53
-
54
-
55
-
56
-
57
-
58
-
59
-
60
-
61
-
62
-
63
-
64
-
65
-
66
-
67
-
68
-
69
-
70
-
71
-
72
-
73
-
74
-
75
-
76
-
77
-
78
-
79
-
80
-
81
-
82
 |
 |

40
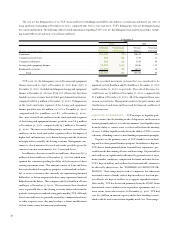
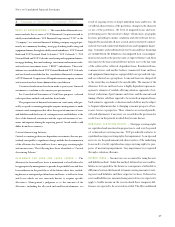
STOCKHOLDERS’ EQUITY – Stockholders’ equity at December
31, 2001 was $917 million, or 8.1% of total assets, up from $910.2
million, or 8.1% of total assets, at December 31, 2000. The increase
in stockholders’ equity is primarily due to net income of $207.3 mil-
lion for the year ended December 31, 2001, partially offset by the
repurchase of 3.7 million shares of TCF’s common stock at a cost of
$148 million and the payment of $77.5 million in dividends on com-
mon stock. Since January 1, 1998, the Company has repurchased 18.6
million shares of TCF’s common stock at an average cost of $29.04
per share. At December 31, 2001, average total equity to average assets
was 7.78% compared to 7.58% at December 31, 2000. Dividends
paid to common shareholders on a per share basis totaled $1.00 in
2001, an increase of 21.2% from $.825 in 2000. TCF’s dividend
payout ratio was 37.04% in 2001 and 35.11% in 2000. The
Company’s primary funding sources for common dividends are div-
idends received from its subsidiary banks. At December 31, 2001,
TCF and its bank subsidiaries exceeded their regulatory capital
requirements and are considered “well-capitalized” under guidelines
established by the Federal Reserve Board and the Office of the
Comptroller of the Currency pursuant to the Federal Deposit
Insurance Corporation Improvement Act of 1991. See Note 14 of
Notes to Consolidated Financial Statements. TCF does not have any
trust preferred securities or other quasi-equity instruments.
TCF has used stock options as a form of employee compensation
only to a limited extent. At December 31, 2001, the amount of incen-
tive stock options outstanding was .48% of total shares outstanding.
MARKET RISK – INTEREST-RATE RISK – TCF’s results of
operations are dependent to a large degree on its net interest income
and the Company’s ability to manage its interest-rate risk. Although
TCF manages other risks, such as credit and liquidity risk, in the nor-
mal course of its business, the Company considers interest-rate risk
to be its most significant market risk. TCF, like most financial insti-
tutions, has a material interest-rate risk exposure to changes in both
short-term and long-term interest rates as well as variable index inter-
est rates (e.g., prime). Since TCF does not hold a trading portfolio,
the Company is not exposed to market risk from trading activities.
Like most financial institutions, TCF’s interest income and cost
of funds are significantly affected by general economic conditions
and by policies of regulatory authorities. The mismatch between matu-
rities and interest-rate sensitivities of assets and liabilities results in
interest-rate risk. TCF’s Asset/Liability Management Committee
manages TCF’s interest-rate risk based on interest rate expectations
and other factors. The principal objective of TCF’s asset/liability
management activities is to provide maximum levels of net interest
income while maintaining acceptable levels of interest-rate risk and
liquidity risk and facilitating the funding needs of the Company.
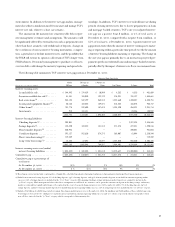
Although the measure is subject to a number of assumptions and
is only one of a number of measurements, management believes the
interest-rate gap (difference between interest-earning assets and
interest-bearing liabilities repricing within a given period) is an
important indication of TCF’s exposure to interest-rate risk and the
related volatility of net interest income in a changing interest rate
TCF does not have any unconsolidated subsidiaries, partnerships, special purpose entities or other forms of off-balance-sheet borrow-
ings. See Note 19 of Notes to Consolidated Financial Statements for information relating to off-balance-sheet instruments.
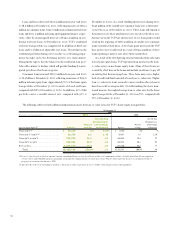
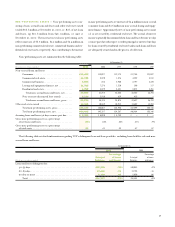
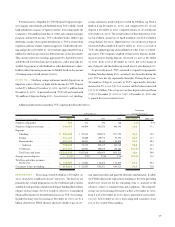
CONTRACTUAL OBLIGATIONS AND COMMERCIAL COMMITMENTS – As disclosed in the Notes to Consolidated Financial Statements,
TCF has certain obligations and commitments to make future payments under contracts. At December 31, 2001, the aggregate contractual
obligations (excluding bank deposits) and commercial commitments are as follows:
Payments Due by Period
Contractual Obligations Less than 1-3 4-5 After 5
(Dollars in thousands) Total 1 year Years Years Years
Total borrowings. . . . . . . . . . . . . . . . . . . . . . . . . . . . . $3,023,025 $ 719,859 $1,577,204 $303,462 $422,500
Annual rental commitments under
non-cancellable operating leases . . . . . . . . . . . . . . . 118,048 16,649 29,067 23,898 48,434
$3,141,073 $ 736,508 $1,606,271 $327,360 $470,934
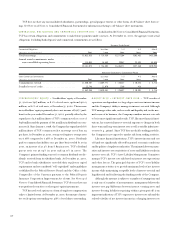
Amount of Commitment – Expiration by Period
Other Commercial Commitments Less than 1-3 4-5 After 5
(Dollars in thousands) Total 1 year Years Years Years
Commitments to lend . . . . . . . . . . . . . . . . . . . . . . . . . $1,550,207 $1,409,771 $ 125,237 $ 10,483 $ 4,716
Standby letters of credit. . . . . . . . . . . . . . . . . . . . . . . . 12,748 11,070 1,260 418 –
$1,562,955 $1,420,841 $ 126,497 $ 10,901 $ 4,716