Samsung 2000 Annual Report Download - page 79
Download and view the complete annual report
Please find page 79 of the 2000 Samsung annual report below. You can navigate through the pages in the report by either clicking on the pages listed below, or by using the keyword search tool below to find specific information within the annual report.-
 1
1 -
2
-
3
-
4
-
5
-
6
-
7
-
8
-
9
-
10
-
11
-
12
-
13
-
14
-
15
-
16
-
17
-
18
-
19
-
20
-
21
-
22
-
23
-
24
-
25
-
26
-
27
-
28
-
29
-
30
-
31
-
32
-
33
-
34
-
35
-
36
-
37
-
38
-
39
-
40
-
41
-
42
-
43
-
44
-
45
-
46
-
47
-
48
-
49
-
50
-
51
-
52
-
53
-
54
-
55
-
56
-
57
-
58
-
59
-
60
-
61
-
62
-
63
-
64
-
65
-
66
-
67
-
68
-
 69
69 -
 70
70 -
 71
71 -
 72
72 -
 73
73 -
 74
74 -
 75
75 -
 76
76 -
 77
77 -
 78
78 -
 79
79 -
 80
80 -
 81
81 -
 82
82 -
 83
83 -
 84
84 -
 85
85 -
 86
86 -
 87
87 -
 88
88
 |
 |

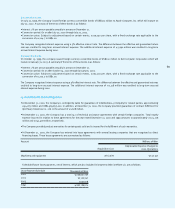
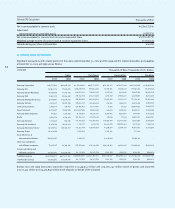
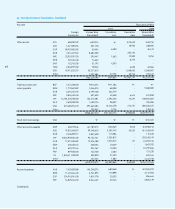
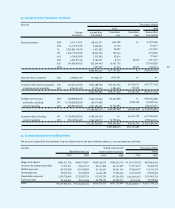
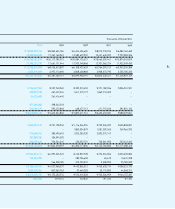
28. Segment Information
A summary of the Company’s operations by business segment and geographic area as of December 31, 2000 and for the year then ended is
as follows (in millions of Won):
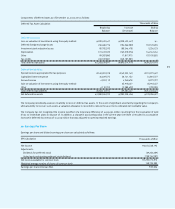
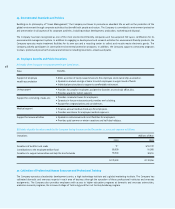
29. Discontinued Operations
On January 11, 2000, the Company established Samsung Thales Co., Ltd. (formerly Samsung Thomson-CSF Co., Ltd.), a 50:50 joint venture
with Thomson-CSF International with capital stock of 270 billion. Pursuant to the joint venture agreement, the Company sold its defense
electronics division to the joint venture on February 28, 2000. Components of amounts reflected in the income statement and balance sheet
are as follows:
Discontinued operation information for the year ended December 31, 2000 and 1999 is as follows:
30. Reclassification of 1999 Amounts
Certain amounts in the 1999 financial statements have been reclassified to conform to the 2000 presentation. These reclassifications had
no effect on previously reported net income or shareholders’ equity.
79
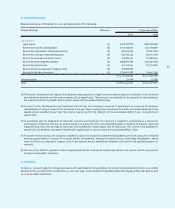
Financial Data by Business Segment
1. Sales
Sales to unaffiliated customers
Intersegment sales
2. Operating profit (loss)
3. Tangible and intangible assets
4. Depreciation
Semiconductors
12,953,399
1,081,049
14,034,448
6,057,705
10,016,939
2,308,874
Other Areas
1,625,331
217,619
1,842,950
(242,854)
128,100
64,450
Information &
Communications
7,610,397
22,160
7,632,557
908,401
1,598,400
188,767
Home
Appliances
2,745,049
18,202
2,763,251
187,309
412,787
36,786
Digital Media
9,349,576
50,154
9,399,730
524,594
453,619
67,352
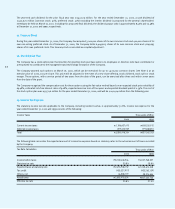
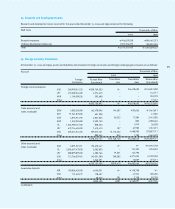
Financial Data by Geographic Area
1. Sales
2. Tangible and intangible assets
3. Depreciation
America
9,916,847
4,820,126
1,078,890
Africa
88,827
10,492
891
Europe
5,834,774
2,311,339
501,984
Asia
7,539,921
3,580,267
787,489
Domestic
10,903,384
1,867,621
296,975
Gain on Disposal of Discontinued Operation
Assets
Liabilities
Net assets of discontinued operations
Proceeds from disposal
Gain on disposal
Millions of Won
122,991
64,512
58,479
211,758
153,279
Discontinued Operation Information
Sales
Operating loss
Tangible assets
2,645
(698)
13,412
166,731
(4,852)
13,580
Millions of Won
2000 1999