Samsung 2000 Annual Report Download - page 77
Download and view the complete annual report
Please find page 77 of the 2000 Samsung annual report below. You can navigate through the pages in the report by either clicking on the pages listed below, or by using the keyword search tool below to find specific information within the annual report.-
 1
1 -
2
-
3
-
4
-
5
-
6
-
7
-
8
-
9
-
10
-
11
-
12
-
13
-
14
-
15
-
16
-
17
-
18
-
19
-
20
-
21
-
22
-
23
-
24
-
25
-
26
-
27
-
28
-
29
-
30
-
31
-
32
-
33
-
34
-
35
-
36
-
37
-
38
-
39
-
40
-
41
-
42
-
43
-
44
-
45
-
46
-
47
-
48
-
49
-
50
-
51
-
52
-
53
-
54
-
55
-
56
-
57
-
58
-
59
-
60
-
61
-
62
-
63
-
64
-
65
-
66
-
 67
67 -
 68
68 -
 69
69 -
 70
70 -
 71
71 -
 72
72 -
 73
73 -
 74
74 -
 75
75 -
 76
76 -
 77
77 -
 78
78 -
 79
79 -
 80
80 -
 81
81 -
 82
82 -
 83
83 -
 84
84 -
 85
85 -
 86
86 -
 87
87 -
88
 |
 |

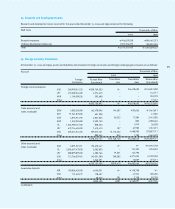
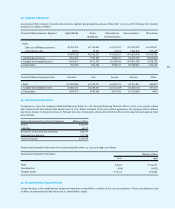
23. Foreign Currency Translation, Continued
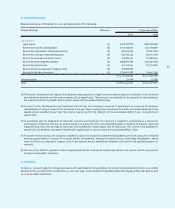
24. Accounts Relating to Gross Added Value
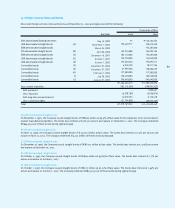
The accounts required for the calculation of gross added value for the year ended December 31, 2000 and 1999 are as follows:
77
Account
Wages and salaries
Provision for severance benefits
Welfare expenses
Rental expenses
Depreciation expenses
Taxes and dues
Total
834,611,555
77,271,611
139,507,030
98,510,754
2,229,728,643
39,423,541
3,419,053,134
Thousands of Won
Totals
2000 1999
600,713,891
53,661,311
107,439,899
70,316,803
2,272,587,224
29,944,096
3,134,663,224
369,566,573
35,441,860
54,162,467
14,666,185
112,347,734
56,790,194
642,975,013
248,352,155
36,742,659
35,691,475
11,503,433
119,256,530
65,584,747
517,130,999
1,204,178,128
112,713,471
193,669,497
113,176,939
2,342,076,377
96,213,735
4,062,028,147
849,066,046
90,403,970
143,131,374
81,820,236
2,391,843,754
95,528,843
3,651,794,223
Selling, General and
Administrative Expenses
2000 1999
Manufacturing Cost
2000 1999
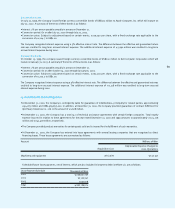
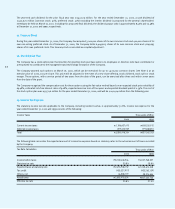
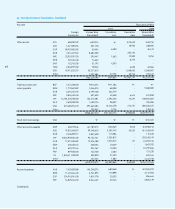
Account
Accrued expenses
Advances from customers
Long-term other accounts payable,
including current maturities
Foreign currency notes
and bonds, including
current maturities
Long-term debt, including
current maturities
Translation
Gain
–
–
–
–
–
20,929
–
20,929
–
–
7,326,412
101,038
7,427,450
–
3,005,328
–
3,005,328
3,474,720
–
3,474,720
34,121,680
Korean Won
(translated)
7,973,785
574,917
4,762,907
3,133,840
772,647
2,291,291
257,403,820
1,548,181
289,245,146
–
157,771,148
–
157,771,148
352,962,000
165,920,136
1,266,643,757
1,785,525,893
191,834,640
1,395,446,144
1,587,280,784
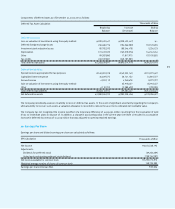
Translation
Loss
54,908
21,495
33,897
735,444
92,814
8,713
16,461,750
21,743
17,707,006
422,404
27,374,670
2,096,550
29,471,220
5,631,000
–
46,726,983
52,357,983
–
94,925,046
94,925,046
237,838,325
Korean Won
(translated)
8,410,791
2,604,824
4,327,893
18,243,103
2,213,500
3,184,221
332,646,460
1,707,739
390,392,342
4,948,179
335,488,920
10,170,465
345,659,385
182,112,000
162,914,808
1,061,405,607
1,406,432,415
188,359,920
1,046,168,677
1,234,528,597
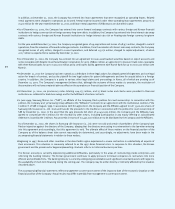
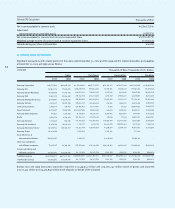
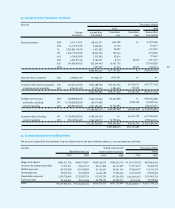
Foreign
Currencies
GBP 4,471,779.31
HKD 16,127,945.39
ITL 7,057,881,785.00
JPY 1,656,175,340.00
NLG 4,108,509.05
SGD 4,381,875.66
USD 264,068,000.03
Other
USD 3,928,061.09
USD 266,324,459.00
EUR 8,566,261.00
DEM 300,000,000.00
JPY 14,790,000,000.00
USD 885,890,000.00
JPY 17,100,000,000.00
USD 830,490,336.87
Thousands of Won
2000 1999