Samsung 2000 Annual Report Download - page 49
Download and view the complete annual report
Please find page 49 of the 2000 Samsung annual report below. You can navigate through the pages in the report by either clicking on the pages listed below, or by using the keyword search tool below to find specific information within the annual report.-
 1
1 -
2
-
3
-
4
-
5
-
6
-
7
-
8
-
9
-
10
-
11
-
12
-
13
-
14
-
15
-
16
-
17
-
18
-
19
-
20
-
21
-
22
-
23
-
24
-
25
-
26
-
27
-
28
-
29
-
30
-
31
-
32
-
33
-
34
-
35
-
36
-
37
-
38
-
 39
39 -
 40
40 -
 41
41 -
 42
42 -
 43
43 -
 44
44 -
 45
45 -
 46
46 -
 47
47 -
 48
48 -
 49
49 -
 50
50 -
 51
51 -
 52
52 -
 53
53 -
 54
54 -
 55
55 -
 56
56 -
 57
57 -
 58
58 -
 59
59 -
60
-
61
-
62
-
63
-
64
-
65
-
66
-
67
-
68
-
69
-
70
-
71
-
72
-
73
-
74
-
75
-
76
-
77
-
78
-
79
-
80
-
81
-
82
-
83
-
84
-
85
-
86
-
87
-
88
 |
 |

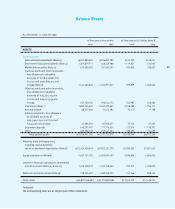
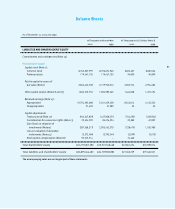
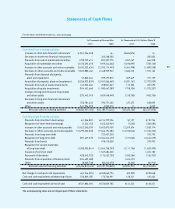
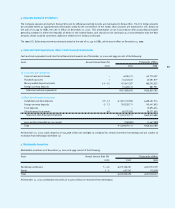
As of December 31, 2000 and 1999
In Thousands of Korean Won In Thousands of U.S. Dollars (Note 3)
2000 1999 2000 1999
ASSETS
Current assets:
Cash and cash equivalents (Note 4) 521,883,690 526,829,785 $414,522 $418,451
Short-term financial instruments (Note 4) 1,409,879,711 648,343,188 1,119,841 514,967
Marketable securities (Note 5) 673,340,493 237,450,347 534,822 188,602
Trade accounts and notes receivable,
less allowance for doubtful
accounts of 129,404,961,000
in 2000 and 133,890,311,000
in 1999 (Note 6) 1,162,483,845 1,334,971,347 923,339 1,060,343
Other accounts and notes receivable,
less allowance for doubtful
accounts of 15,232,211,000
in 2000 and 29,131,354,000
in 1999 659,700,104 690,544,173 523,987 548,486
Inventories (Note 7) 2,802,763,625 2,261,379,652 2,226,182 1,796,171
Accrued income 88,277,060 21,614,484 70,117 17,168
Advance payments, less allowance
for doubtful accounts of
14,346,074,000 in 2000 and
745,090,000 in 1999 44,286,594 84,940,457 35,176 67,467
Guarantee deposits 160,287,992 171,716,625 127,314 136,391
Other 233,538,148 219,441,221 185,494 174,299
Total current assets 7,756,441,262 6,197,231,279 $6,160,794 $4,922,345
Property, plant and equipment,
including revalued portion,
net of accumulated depreciation (Note 8) 12,324,428,649 9,822,251,279 $9,789,062 $7,801,629
Equity investments (Note 9) 5,409,741,103 6,050,044,457 4,296,856 4,805,436
Long-term financial instruments, receivables
and other assets (Notes 4, 6 and 10) 1,226,228,972 1,559,748,944 973,971 1,238,879
Deferred income tax assets (Note 19) 178,206,497 1,080,526,923 141,546 858,242
Total assets 26,895,046,483 24,709,802,882 $21,362,229 $19,626,531
Continued;
The accompanying notes are an integral part of these statements.
Balance Sheets
49