Samsung 2000 Annual Report Download - page 54
Download and view the complete annual report
Please find page 54 of the 2000 Samsung annual report below. You can navigate through the pages in the report by either clicking on the pages listed below, or by using the keyword search tool below to find specific information within the annual report.-
 1
1 -
2
-
3
-
4
-
5
-
6
-
7
-
8
-
9
-
10
-
11
-
12
-
13
-
14
-
15
-
16
-
17
-
18
-
19
-
20
-
21
-
22
-
23
-
24
-
25
-
26
-
27
-
28
-
29
-
30
-
31
-
32
-
33
-
34
-
35
-
36
-
37
-
38
-
39
-
40
-
41
-
42
-
43
-
 44
44 -
 45
45 -
 46
46 -
 47
47 -
 48
48 -
 49
49 -
 50
50 -
 51
51 -
 52
52 -
 53
53 -
 54
54 -
 55
55 -
 56
56 -
 57
57 -
 58
58 -
 59
59 -
 60
60 -
 61
61 -
 62
62 -
 63
63 -
 64
64 -
65
-
66
-
67
-
68
-
69
-
70
-
71
-
72
-
73
-
74
-
75
-
76
-
77
-
78
-
79
-
80
-
81
-
82
-
83
-
84
-
85
-
86
-
87
-
88
 |
 |

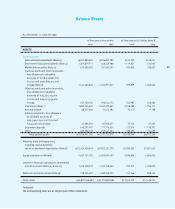
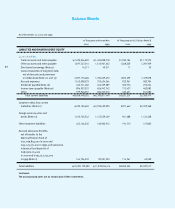
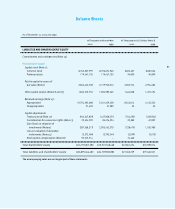
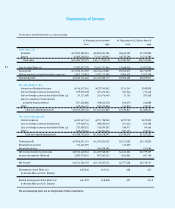
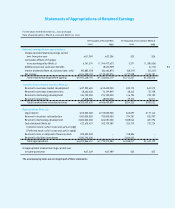
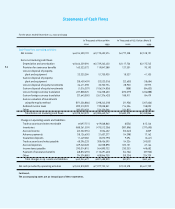
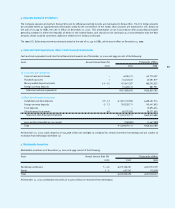
For the years ended December 31, 2000 and 1999
In Thousands of Korean Won In Thousands of U.S. Dollars (Note 3)
2000 1999 2000 1999
Cash flows from operating activities:
Net income 6,014,530,192 3,170,402,574 $4,777,228 $2,518,191
Items not involving cash flows:
Depreciation and amortization 2,666,229,096 2,739,262,420 $2,117,736 $2,175,745
Provision for severance benefits 160,523,572 119,847,588 127,501 95,193
Loss on disposal of property,
plant and equipment 23,325,284 51,750,930 18,527 41,105
Gain on disposal of property,
plant and equipment (28,459,459) (23,523,016) (22,605) (18,684)
Loss on disposal of equity investments 36,411,398 32,702,754 28,920 25,975
Gain on disposal of equity investments (1,016,307) (106,514,836) (808) (84,603)
Loss on foreign currency translation 237,838,325 106,358,633 (692,079) (236,888)
Gain on foreign currency translation (27,643,050) (261,376,425) 188,911 84,479
Gain on valuation of investments
using the equity method (871,326,886) (298,242,218) (21,956) (207,606)
Deferred income taxes 899,310,939 199,038,851 714,306 158,092
Other 283,050,658 526,336,066 224,822 418,058
Total items not involving cash flows 3,378,243,570 3,085,640,747 $2,683,275 $2,450,866
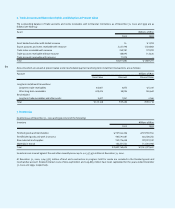
Changes in operating assets and liabilities:
Trade accounts and notes receivable (697,751) 19,068,860 $(554) $15,146
Inventories (488,361,559) (475,512,306) (387,896) (377,690)
Accrued income (65,522,394) 3,536,432 (52,043) 2,809
Advance payments (18,126,650) 21,607,277 (14,398) 17,162
Guarantee deposits 11,449,282 (3,072,795) 9,094 (2,441)
Trade accounts and notes payable 68,396,233 308,456,595 54,326 245,001
Accrued expenses 409,340,228 84,558,898 325,131 67,164
Income taxes payable 290,014,815 564,890,732 230,353 448,682
Payment of severance benefits (68,872,692) (110,691,623) (54,704) (87,920)
Other (74,574,885) 408,846,750 (59,234) 324,739
Total changes in op. assets and liabilities 63,044,627 821,688,820 $50,075 $652,652
Net cash provided by operating activities 9,455,818,389 7,077,732,141 $7,510,578 $5,621,709
Continued;
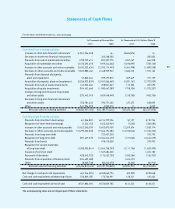
The accompanying notes are an integral part of these statements.
Statements of Cash Flows
54