Samsung 2000 Annual Report Download - page 74
Download and view the complete annual report
Please find page 74 of the 2000 Samsung annual report below. You can navigate through the pages in the report by either clicking on the pages listed below, or by using the keyword search tool below to find specific information within the annual report.-
 1
1 -
2
-
3
-
4
-
5
-
6
-
7
-
8
-
9
-
10
-
11
-
12
-
13
-
14
-
15
-
16
-
17
-
18
-
19
-
20
-
21
-
22
-
23
-
24
-
25
-
26
-
27
-
28
-
29
-
30
-
31
-
32
-
33
-
34
-
35
-
36
-
37
-
38
-
39
-
40
-
41
-
42
-
43
-
44
-
45
-
46
-
47
-
48
-
49
-
50
-
51
-
52
-
53
-
54
-
55
-
56
-
57
-
58
-
59
-
60
-
61
-
62
-
63
-
 64
64 -
 65
65 -
 66
66 -
 67
67 -
 68
68 -
 69
69 -
 70
70 -
 71
71 -
 72
72 -
 73
73 -
 74
74 -
 75
75 -
 76
76 -
 77
77 -
 78
78 -
 79
79 -
 80
80 -
 81
81 -
 82
82 -
 83
83 -
 84
84 -
85
-
86
-
87
-
88
 |
 |

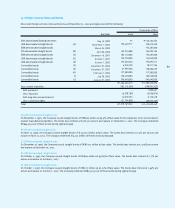
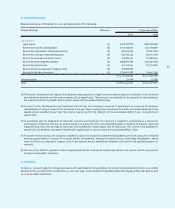
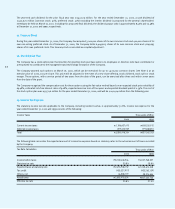
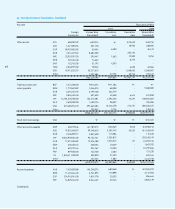
21. Related Party Transactions
Significant transactions with related parties for the years ended December 31, 2000 and the 1999 and the related receivables and payables
at December 31, 2000 and 1999 are as follows:
During 2000 and 1999 Samsung Corporation exported 21,559,951 million and 15,782,247 million worth of goods and imported
3,727,413 million and 4,516,849 million worth of goods on behalf of the Company.
74
28,793,503
130,501,116
56,334,467
91,541,195
37,108,881
3,609,217
2,542,910
12,978,039
961,821
8,526,218
1,212,420
16,818,904
122,275,922
196,412,048
544,364,061
73,615,997
$13,533,592
1,327,596,719
$13,533,592
40,403,924
77,470,578
91,092,651
89,062,680
113,570,242
15,357,953
930,863
19,843,835
1,393,555
4,326,609
863,025
25,682,263
105,369,817
-
-
46,303,308
$10,678,976
631,671,303
$10,678,976
1,157,468,843
1,550,459,715
814,221,910
298,140,093
782,325,532
187,041,979
124,882,862
121,463,67430
30,108,821
151,182,121
111,146,302
3,157,127
172,262,778
2,531,563
1,905,131
577,595,366
$6,119,476
6,085,893,817
$6,119,476
625,112,597
987,862,496
724,502,937
272,211,537
667,459,514
162,368,633
94,919,970
95,803,645
44,292,171
119,891,015
101,364,743
2,695,194
124,600,307
-
-
318,196,254
$4,141,759
4,341,281,013
$4,141,759
72,366,272
13,165,784
6,747,530
3,716,739
12,665,328
994,946
5,500
620,024
5,267,064
88,034
115,380,900
52,651,475
41,288,409
1,337,916
39,633,044
583,236,542
$162,185
949,165,507
$162,185
72,017,084
10,238,439
8,910,815
29,833,411
21,741,911
1,468,672
37,927
6,208,306
5,337,569
97,653
112,901,005
158,751,364
31,008,173
-
-
86,429,814
$156,532
544,982,143
$156,532
419,022,525
119,351,143
78,607,286
46,475,852
171,160,367
35,672,995
102,867,427
25,480,211
9,049,606
45,899,927
13,422,658
5,210,222
40,862,672
711,234
37,084,362
119,485,693
$182,903
1,270,364,180
$182,903
198,836,293
176,395,225
130,437,215
28,926,439
170,879,386
10,543,300
93,004,770
21,518,655
14,903,224
43,546,741
20,037,500
7,086,126
31,673,599
-
-
55,263,314
$582,616
1,003,051,787
$582,616
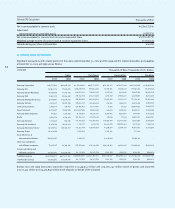
Company
Samsung Corporation
Samsung SDI
Samsung Electro-Mechanics
Samsung SDS
Samsung Kwangju Electronics
Samsung Techwin
Cheil Communications
Seoul Commtech
Samsung Heavy Industries
Novita
Samsung Everland
Samsung Life Insurance
Samsung Electronics Service
Samsung Thales
Korea Electronics &
Information Distribution
Other local subsidiaries
and affiliated companies
Foreign subsidiaries and
affiliated companies
Total Won currency
Total foreign currency
Sales
2000 1999
Purchases
2000 1999
Receivables
2000 1999
Payables
2000 1999
Thousands of Won, Thousands of U.S. Dollars
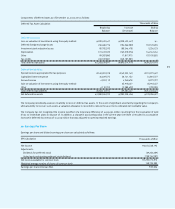
Diluted EPS Calculation
Net income available for common stock
Adjustment:
Interest expense on convertible bonds
Net income available for common stock & common equivalent share
Weighted average number of common stock & common equivalent shares
Diluted earnings per share in Korean Won
5,206,572,816
18,855,974
5,225,428,790
151,931,513
34,393
Thousands of Won