Samsung 2000 Annual Report Download - page 63
Download and view the complete annual report
Please find page 63 of the 2000 Samsung annual report below. You can navigate through the pages in the report by either clicking on the pages listed below, or by using the keyword search tool below to find specific information within the annual report.-
 1
1 -
2
-
3
-
4
-
5
-
6
-
7
-
8
-
9
-
10
-
11
-
12
-
13
-
14
-
15
-
16
-
17
-
18
-
19
-
20
-
21
-
22
-
23
-
24
-
25
-
26
-
27
-
28
-
29
-
30
-
31
-
32
-
33
-
34
-
35
-
36
-
37
-
38
-
39
-
40
-
41
-
42
-
43
-
44
-
45
-
46
-
47
-
48
-
49
-
50
-
51
-
52
-
 53
53 -
 54
54 -
 55
55 -
 56
56 -
 57
57 -
 58
58 -
 59
59 -
 60
60 -
 61
61 -
 62
62 -
 63
63 -
 64
64 -
 65
65 -
 66
66 -
 67
67 -
 68
68 -
 69
69 -
 70
70 -
 71
71 -
 72
72 -
 73
73 -
74
-
75
-
76
-
77
-
78
-
79
-
80
-
81
-
82
-
83
-
84
-
85
-
86
-
87
-
88
 |
 |

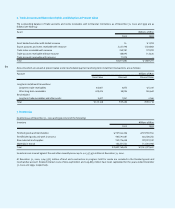
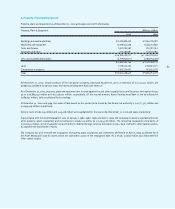
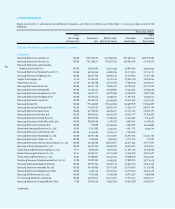
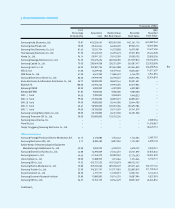
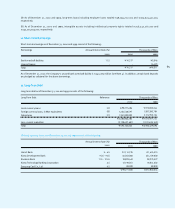
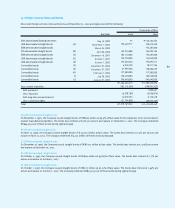
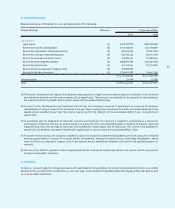
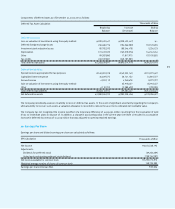
9. Equity Investments, Continued
63
Samsung India Electronics, Ltd.
Samsung Asia Private, Ltd.
Samsung Vina Electronics Co., Ltd.
Thai Samsung Electronics Co., Ltd.
Novita Co., Ltd.
Samsung Kwangju Electronics Co., Ltd.
Samsung Capital Co., Ltd.
Samsung Card Co., Ltd.
STECO, Ltd.
DNS Korea Co., Ltd.
Samsung Electronics Service Co., Ltd.
Korea Electronics & Information Distribution Co., Ltd.
Blueteck ITL
Bokwang VFUND
Bokwang XFUND
SVIC Fund
SVIC Fund
SVIC Fund
SVIC Fund
SVIC Fund
Samsung Corning Micro-Optics Co., Ltd.
Samsung Thomsom-CSF Co., Ltd.
Samsung Glass America, Inc.
PrimeTel, Ltd.
Tianjin Tongguang Samsung Electronics Co., Ltd.
Affiliated companies:
Samsung Portugal Productos Electro-Mechanicos S.A.
Samsung Electronics (UK), Ltd.
Syrian-Korean Telecommunication Equipment
Manufacturing Establishment Co., Ltd.
Samsung Electronics Huizhou Co., Ltd.
Samsung Japan Co., Ltd.
Union Optical Co., Ltd.
Samsung SDI Co., Ltd.
Samsung Electro-Mechanics Co., Ltd.
Samsung Techwin Co., Ltd.
Seoul Commtech Co., Ltd.
Samsung Economic Research Institute
Samsung SDS Co., Ltd.
Continued;
Recorded
Book Value
21,261,110
89,033,174
16,079,981
29,371,870
29,000,155
277,079,813
263,587,477
422,344,859
18,353,237
6,146,792
33,814,936
39,591,631
33,219,004
6,329,003
9,000,200
9,948,323
30,893,377
20,444,785
102,692,786
29,741,079
26,701,530
–
–
–
–
1,742,504
7,122,282
4,578,192
23,721,093
37,176,293
1,274,366
488,122,167
405,271,665
222,859,819
12,037,741
18,087,984
28,057,349
Recorded
Book Value
15,387,943
53,907,380
15,677,406
25,416,928
23,090,236
155,753,593
222,920,398
234,398,940
14,217,607
3,941,894
32,934,818
–
–
–
–
–
–
–
–
–
–
–
2,509,254
14,218,067
28,425,751
2,487,701
6,305,140
3,325,921
37,876,046
53,351,029
3,153,721
–
266,167,164
211,725,943
5,174,213
9,027,093
26,324,854
Market Value
(Net Book Value)
20,569,458
66,333,455
16,273,828
34,255,673
29,142,399
284,948,785
230,215,509
397,694,988
18,729,136
17,686,472
36,790,237
38,692,144
29,993,255
6,329,003
9,000,200
9,948,323
30,893,377
20,444,785
102,692,786
29,741,079
26,701,530
133,752,226
–
–
–
1,766,443
8,857,024
4,578,192
27,244,272
82,082,042
1,274,366
457,120,673
387,230,169
147,717,981
12,758,519
18,116,210
33,544,429
Acquisition
Cost
15,526,467
20,454,044
13,531,704
37,422,945
29,991,151
192,675,696
230,849,938
153,387,755
12,239,960
6,542,382
29,999,990
30,000,000
22,993,240
5,000,000
9,000,000
9,900,000
29,700,000
19,800,000
98,500,000
29,700,000
28,135,800
135,000,000
–
–
–
2,123,880
8,280,489
2,060,925
16,390,839
47,766,973
17,388,905
423,721,523
359,237,063
196,321,791
4,191,977
17,880,000
12,752,735
Percentage
of Ownership
73.87
70.00
81.62
91.50
96.14
94.25
75.03
56.59
51.00
61.08
83.33
96.77
100.00
83.33
81.82
99.00
99.00
99.00
65.67
99.00
50.00
50.00
–
–
–
24.15
5.17
49.00
44.88
49.00
20.00
19.32
22.80
22.93
30.30
29.80
26.27
2000 1999
Thousands of Won