Samsung 2000 Annual Report Download - page 52
Download and view the complete annual report
Please find page 52 of the 2000 Samsung annual report below. You can navigate through the pages in the report by either clicking on the pages listed below, or by using the keyword search tool below to find specific information within the annual report.-
 1
1 -
2
-
3
-
4
-
5
-
6
-
7
-
8
-
9
-
10
-
11
-
12
-
13
-
14
-
15
-
16
-
17
-
18
-
19
-
20
-
21
-
22
-
23
-
24
-
25
-
26
-
27
-
28
-
29
-
30
-
31
-
32
-
33
-
34
-
35
-
36
-
37
-
38
-
39
-
40
-
41
-
 42
42 -
 43
43 -
 44
44 -
 45
45 -
 46
46 -
 47
47 -
 48
48 -
 49
49 -
 50
50 -
 51
51 -
 52
52 -
 53
53 -
 54
54 -
 55
55 -
 56
56 -
 57
57 -
 58
58 -
 59
59 -
 60
60 -
 61
61 -
 62
62 -
63
-
64
-
65
-
66
-
67
-
68
-
69
-
70
-
71
-
72
-
73
-
74
-
75
-
76
-
77
-
78
-
79
-
80
-
81
-
82
-
83
-
84
-
85
-
86
-
87
-
88
 |
 |

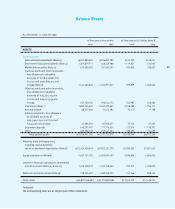
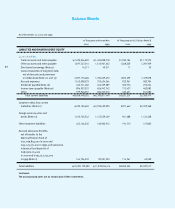
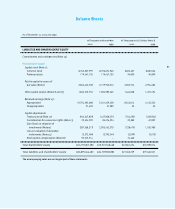
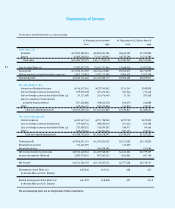
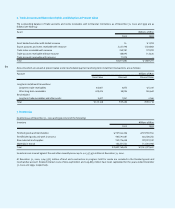
For the years ended December 31, 2000 and 1999
In Thousands of Korean Won In Thousands of U.S. Dollars (Note 3)
2000 1999 2000 1999
Sales (Note 21):
Domestic 10,903,383,976 8,850,624,784 $8,660,353 $7,029,885
Export 23,380,368,303 17,267,160,967 18,570,586 13,714,980
Total sales 34,283,752,279 26,117,785,751 $27,230,939 $20,744,865
Cost of sales (Note 21) 21,993,377,770 17,661,171,944 17,468,926 14,027,936
Gross profit 12,290,374,509 8,456,613,807 $9,762,013 $6,716,929
Selling, general and administrative expenses 4,855,219,849 3,975,113,690 3,856,410 3,157,358
Operating profit 7,435,154,660 4,481,500,117 $5,905,603 $3,559,571
Non-operating income:
Interest and dividend income 156,427,345 227,740,962 $124,247 $180,890
Gain on foreign currency transactions 299,070,108 267,472,334 237,546 212,448
Gain on foreign currency translation (Note 23) 34,121,680 261,416,440 27,102 207,638
Gain on valuation of investments
using the equity method 871,326,886 298,242,218 692,079 236,888
Other 649,446,121 592,472,848 515,843 470,591
Total non-operating income 2,010,392,140 1,647,344,802 $1,596,817 $1,308,455
Non-operating expenses:
Interest expense 343,367,140 721,198,940 $272,730 $572,835
Loss on foreign currency transactions 279,048,744 280,490,610 221,643 222,788
Loss on foreign currency translation (Note 23) 237,838,325 106,594,502 188,911 84,666
Other 638,478,440 726,334,345 507,131 576,914
Total non-operating expenses 1,498,732,649 1,834,618,397 $1,190,415 $1,457,203
Ordinary profit 7,946,814,151 4,294,226,522 $6,312,005 $3,410,823
Extraordinary income 153,634,395 – 122,029 –
Extraordinary loss – 266,258,185 – 211,484
Net income before income taxes 8,100,448,546 4,027,968,337 $6,434,034 $3,199,339
Income tax expense (Note 19) 2,085,918,354 857,565,763 1,656,806 681,148
Net income 6,014,530,192 3,170,402,574 $4,777,228 $2,518,191
Earnings per share (Note 20) 35,006 19,214 $28 $15
(In Korean Won and U.S. Dollars)
Diluted earnings per share (Note 20) 34,393 18,848 $27 $14.9
(In Korean Won and U.S. Dollars)
The accompanying notes are an integral part of these statements.
Statements of Income
52