Samsung 2000 Annual Report Download - page 62
Download and view the complete annual report
Please find page 62 of the 2000 Samsung annual report below. You can navigate through the pages in the report by either clicking on the pages listed below, or by using the keyword search tool below to find specific information within the annual report.-
 1
1 -
2
-
3
-
4
-
5
-
6
-
7
-
8
-
9
-
10
-
11
-
12
-
13
-
14
-
15
-
16
-
17
-
18
-
19
-
20
-
21
-
22
-
23
-
24
-
25
-
26
-
27
-
28
-
29
-
30
-
31
-
32
-
33
-
34
-
35
-
36
-
37
-
38
-
39
-
40
-
41
-
42
-
43
-
44
-
45
-
46
-
47
-
48
-
49
-
50
-
51
-
 52
52 -
 53
53 -
 54
54 -
 55
55 -
 56
56 -
 57
57 -
 58
58 -
 59
59 -
 60
60 -
 61
61 -
 62
62 -
 63
63 -
 64
64 -
 65
65 -
 66
66 -
 67
67 -
 68
68 -
 69
69 -
 70
70 -
 71
71 -
 72
72 -
73
-
74
-
75
-
76
-
77
-
78
-
79
-
80
-
81
-
82
-
83
-
84
-
85
-
86
-
87
-
88
 |
 |

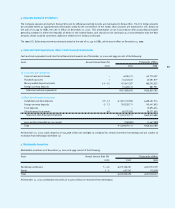
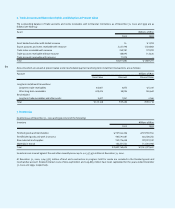
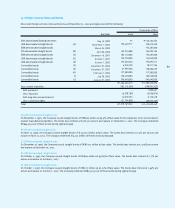
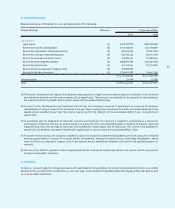
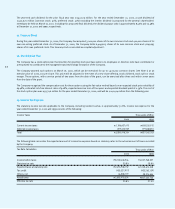
9. Equity Investments
Equity investments in subsidiaries and affiliated companies, and other investments as of December 31, 2000 and 1999 consist of the
following:
62
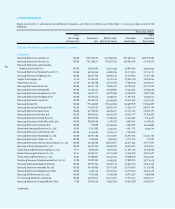
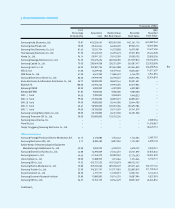
(1) Equity investments in subsidiaries and affiliated companies
Subsidiaries:
Samsung Electronics Canada, Inc.
Samsung Electronics America, Inc.
Samsung Electronics Latinoamerica
Panama (Zone Libre) S.A.
Samsung Electronics Mexicana S.A. de C.V.
Samsung Electronics Argentina S.A.
Cagent Technologies, Inc.
Alpha Processor, Inc.
Samsung Electronics Iberia, S.A.
Samsung Electronics Svenska AB
Samsung Electronics Hungarian Co., Ltd.
Samsung Electronica Portuguesa S.A.
Samsung Electronics France S.A.
Samsung Europe PLC
Samsung Electronics Holding GmbH
Samsung Electronics Italia, S.p.A.
Samsung Electronics Benelux B.V.
Samsung Electronics Polska, Sp.Zo.O
Samsung Electronics South Africa (Pty) Ltd.
Samsung Electronics Overseas B.V.
Uzbekistan Samsung Electronica Co., Ltd.
Samsung Electronics India Private, Ltd.
Samsung Electronics Hong Kong Co., Ltd.
Samsung Electronics Taiwan Co., Ltd.
Samsung Electronics Suzhou Semiconductor Co., Ltd.
Samsung (China) Investment Co., Ltd
Tianjin Samsung Electronics Display Co., Ltd.
Suzhou Samsung Electronics Co., Ltd.
Tianjin Samsung Electronics Co., Ltd.
Shandong Samsung Telecommunications Co., Ltd.
Samsung Yokohama Research Institute
Samsung Electronics Australia Pty. Ltd.
Samsung Electronics Malaysia Sdn. Bhd.
Samsung Gulf Electronics Co., Ltd.
P.T. Samsung Electronics Indonesia
Samsung Electronics Display (M) Sdn. Bhd.
Continued;
Recorded
Book Value
37,409,624
350,001,625
63,895,606
39,171,013
37,310,963
20,334,100
17,602,340
60,795,407
16,424,831
49,339,949
11,307,056
35,616,262
162,689,875
47,226,773
47,154,194
40,316,777
15,623,487
3,595,491
2,302,079
4,041,131
7,583,935
65,292,556
9,171,375
82,671,064
48,623,694
21,251,186
47,268,539
49,238,518
17,805,913
65,845,110
33,718,954
26,197,362
10,973,267
27,913,474
40,043,788
Recorded
Book Value
32,929,230
45,440,513
33,029,905
32,714,719
31,361,130
18,970,664
40,996,621
62,271,067
12,480,220
49,027,338
10,235,514
31,877,434
177,064,807
58,537,194
43,982,797
37,706,970
9,456,425
11,670,423
10,648,885
5,936,797
–
62,634,166
721,209
39,577,031
12,324,814
10,108,585
39,545,497
39,667,002
18,779,418
32,656,218
31,156,982
30,264,479
9,682,868
22,601,517
29,620,515
Market Value
(Net Book Value)
37,068,405
373,057,625
55,551,280
42,820,958
38,081,434
19,745,210
26,514,993
75,865,753
16,329,882
46,970,685
12,038,192
36,928,045
190,442,863
58,022,145
48,240,321
36,442,709
15,780,637
4,139,733
24,728,566
2,624,966
8,224,621
61,451,381
1,524,856
80,373,051
35,559,892
19,017,566
45,774,348
50,262,573
19,498,302
65,845,110
32,971,530
29,272,560
13,528,188
35,271,021
41,867,063
Acquisition
Cost
37,910,597
752,108,617
43,842,300
30,767,040
50,227,700
22,162,492
32,189,788
65,221,118
16,153,454
48,397,117
12,594,046
39,433,410
179,626,805
77,607,622
56,778,556
38,334,024
20,097,600
39,829,558
119,898
3,341,000
6,444,200
48,397,188
1,524,856
46,189,260
36,427,936
9,895,816
60,432,457
47,930,825
13,307,035
33,991,706
40,457,800
4,378,136
7,976,308
56,910,316
21,876,246
Percentage
of Ownership
100.00
100.00
100.00
100.00
100.00
91.48
87.50
100.00
100.00
100.00
100.00
100.00
100.00
100.00
100.00
100.00
100.00
100.00
100.00
80.00
100.00
100.00
100.00
100.00
100.00
59.17
82.41
85.82
59.00
100.00
100.00
100.00
100.00
100.00
75.00
2000 1999
Thousands of Won