Redbox 2006 Annual Report Download - page 71
Download and view the complete annual report
Please find page 71 of the 2006 Redbox annual report below. You can navigate through the pages in the report by either clicking on the pages listed below, or by using the keyword search tool below to find specific information within the annual report.-
 1
1 -
2
-
3
-
4
-
5
-
6
-
7
-
8
-
9
-
10
-
11
-
12
-
13
-
14
-
15
-
16
-
17
-
18
-
19
-
20
-
21
-
22
-
23
-
24
-
25
-
26
-
27
-
28
-
29
-
30
-
31
-
32
-
33
-
34
-
35
-
36
-
37
-
38
-
39
-
40
-
41
-
42
-
43
-
44
-
45
-
46
-
47
-
48
-
49
-
50
-
51
-
52
-
53
-
54
-
55
-
56
-
57
-
58
-
59
-
60
-
 61
61 -
 62
62 -
 63
63 -
 64
64 -
 65
65 -
 66
66 -
 67
67 -
 68
68 -
 69
69 -
 70
70 -
 71
71 -
 72
72 -
 73
73 -
 74
74 -
 75
75 -
 76
76
 |
 |

COINSTAR, INC.
NOTES TO CONSOLIDATED FINANCIAL STATEMENTS—(Continued)
YEARS ENDED DECEMBER 31, 2006, 2005, AND 2004
December 31,
2006 2005
(in thousands)
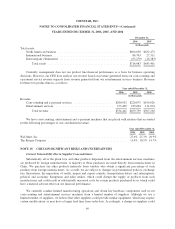
Total assets:
North American business ............................................... $694,650 $632,473
International business .................................................. 86,703 27,311
Intercompany eliminations .............................................. (63,270) (16,383)
Total assets ...................................................... $718,083 $643,401
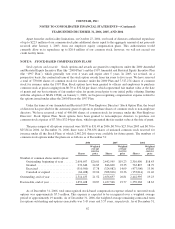
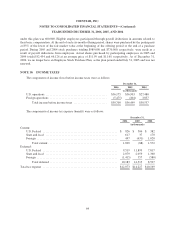
Currently, management does not use product line financial performance as a basis for business operating
decisions. However, our CEO does analyze our revenue based on revenue generated from our coin-counting and
e-payment service revenue separate from revenue generated from our entertainment services business. Revenue
for these two product lines is as follows:
Year ended December 31,
2006 2005 2004
(in thousands)
Revenue:
Coin-counting and e-payment services ........................... $260,952 $220,675 $196,026
Entertainment services ........................................ 273,490 239,064 111,074
Total revenue ........................................... $534,442 $459,739 $307,100
We have coin-counting, entertainment and e-payment machines that are placed with retailers that accounted
for the following percentages of our consolidated revenue:
Year ended December 31,
2006 2005 2004
Wal-Mart, Inc. ............................................................ 27.0% 25.3% 20.9%
The Kroger Company ...................................................... 11.4% 10.5% 14.7%
NOTE 15: CERTAIN SIGNIFICANT RISKS AND UNCERTAINTIES
Current Vulnerability Due to Supplier Concentrations:
Substantially all of the plush toys and other products dispensed from the entertainment services machines
are produced by foreign manufacturers. A majority of these purchases are made directly from manufacturers in
China. We purchase our other products indirectly from vendors who obtain a significant percentage of such
products from foreign manufacturers. As a result, we are subject to changes in governmental policies, exchange
rate fluctuations, the imposition of tariffs, import and export controls, transportation delays and interruptions,
political and economic disruptions and labor strikes, which could disrupt the supply of products from such
manufacturers and could result in substantially increased costs for certain products purchased by us which could
have a material adverse effect on our financial performance.
We currently conduct limited manufacturing operations and obtain key hardware components used in our
coin-counting and entertainment services machines from a limited number of suppliers. Although we use a
limited number of suppliers, we believe that other suppliers could provide similar equipment, which may require
certain modifications or may have a longer lead time from order date. Accordingly, a change in suppliers could
69