Redbox 2006 Annual Report Download - page 52
Download and view the complete annual report
Please find page 52 of the 2006 Redbox annual report below. You can navigate through the pages in the report by either clicking on the pages listed below, or by using the keyword search tool below to find specific information within the annual report.-
 1
1 -
2
-
3
-
4
-
5
-
6
-
7
-
8
-
9
-
10
-
11
-
12
-
13
-
14
-
15
-
16
-
17
-
18
-
19
-
20
-
21
-
22
-
23
-
24
-
25
-
26
-
27
-
28
-
29
-
30
-
31
-
32
-
33
-
34
-
35
-
36
-
37
-
38
-
39
-
40
-
41
-
 42
42 -
 43
43 -
 44
44 -
 45
45 -
 46
46 -
 47
47 -
 48
48 -
 49
49 -
 50
50 -
 51
51 -
 52
52 -
 53
53 -
 54
54 -
 55
55 -
 56
56 -
 57
57 -
 58
58 -
 59
59 -
 60
60 -
 61
61 -
 62
62 -
63
-
64
-
65
-
66
-
67
-
68
-
69
-
70
-
71
-
72
-
73
-
74
-
75
-
76
 |
 |

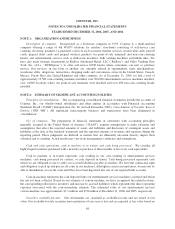
COINSTAR, INC.
NOTES TO CONSOLIDATED FINANCIAL STATEMENTS—(Continued)
YEARS ENDED DECEMBER 31, 2006, 2005, AND 2004
values and estimates from third-party consultants. Adjustments to our purchase price allocation estimates are
made based on our final analysis of the fair value during the allocation period, which is within one year of the
purchase date.
Goodwill and intangible assets: Goodwill represents the excess of cost over the estimated fair value of net
assets acquired, which is not being amortized. We test goodwill for impairment at the reporting unit level on an
annual or more frequent basis as determined necessary. FASB Statement No. 142, Goodwill and Other Intangible
Assets (“SFAS 142”) requires a two-step goodwill impairment test whereby the first step, used to identify potential
impairment, compares the fair value of a reporting unit with its carrying amount including goodwill. If the fair value
of a reporting unit exceeds its carrying amount, goodwill of the reporting unit is considered not impaired and the
second test is not performed. The second step of the impairment test is performed when required and compares the
implied fair value of the reporting unit goodwill with the carrying amount of that goodwill. If the carrying amount
of the reporting unit goodwill exceeds the implied fair value of that goodwill, an impairment loss shall be
recognized in an amount equal to that excess. Based on the annual goodwill test for impairment we performed
during the quarter ended December 31, 2006, we determined there is no impairment of our goodwill.
Our intangible assets are comprised primarily of retailer relationships acquired in connection with our
acquisition of ACMI Holdings, Inc. and its subsidiaries (collectively, “ACMI”) in 2004, The Amusement Factory
L.L.C. (“Amusement Factory”) in 2005, Travelex Money Transfer Limited (now known as “Coinstar Money
Transfer” or “CMT”) in 2006 and other smaller acquisitions. We used a third-party consultant, which used
expectations of future cash flows to estimate the fair value of the acquired retailer relationships. We amortize our
intangible assets on a straight-line basis over their expected useful lives.
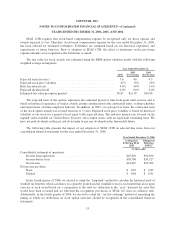
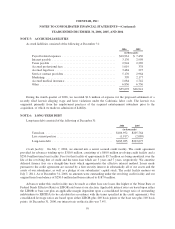
The gross carrying amounts and related accumulated amortization as well as the range of estimated useful
lives of identifiable intangible assets at the reported balance sheet dates were as follows:
Range of
Estimated
Useful Lives
(in years)
Estimated
Weighted
Average
Useful Lives
(in years)
December 31,
(in thousands)
2006 2005
Gross
Amount
Accumulated
Amortization
Gross
Amount
Accumulated
Amortization
Intangible assets:
Retailer relationships .......... 3-10 8.33 $49,757 $11,517 $45,446 $6,099
Other identifiable intangible
assets .................... 3-5 0.36 6,382 1,501 1,401 609
Total .......................... 8.69 $56,139 $13,018 $46,847 $6,708
Based on identifiable intangible assets recorded as of December 31, 2006, and assuming no subsequent
impairment of the underlying assets, the annual estimated aggregate future amortization expenses are as follows:
(in thousands)
2007 .......................................................... $ 6,914
2008 .......................................................... 6,662
2009 .......................................................... 6,392
2010 .......................................................... 5,758
2011 .......................................................... 4,912
Thereafter ...................................................... 12,483
$43,121
50