Redbox 2006 Annual Report Download - page 31
Download and view the complete annual report
Please find page 31 of the 2006 Redbox annual report below. You can navigate through the pages in the report by either clicking on the pages listed below, or by using the keyword search tool below to find specific information within the annual report.-
 1
1 -
2
-
3
-
4
-
5
-
6
-
7
-
8
-
9
-
10
-
11
-
12
-
13
-
14
-
15
-
16
-
17
-
18
-
19
-
20
-
 21
21 -
 22
22 -
 23
23 -
 24
24 -
 25
25 -
 26
26 -
 27
27 -
 28
28 -
 29
29 -
 30
30 -
 31
31 -
 32
32 -
 33
33 -
 34
34 -
 35
35 -
 36
36 -
 37
37 -
 38
38 -
 39
39 -
 40
40 -
 41
41 -
42
-
43
-
44
-
45
-
46
-
47
-
48
-
49
-
50
-
51
-
52
-
53
-
54
-
55
-
56
-
57
-
58
-
59
-
60
-
61
-
62
-
63
-
64
-
65
-
66
-
67
-
68
-
69
-
70
-
71
-
72
-
73
-
74
-
75
-
76
 |
 |
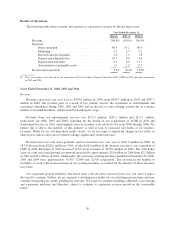
Interest expense increased to $15.7 million in 2006 from $12.9 million in 2005 and $6.3 million in 2004.
The increase is primarily due to higher interest rates. During July 2004 we entered into a $250.0 million term
loan facility and $60 million revolving loan facility to finance our acquisition of ACMI. As of December 31,
2006, $187.0 million was outstanding on our term loan.
Income Taxes
The effective income tax rate was 39.3% in 2006 compared with 39.0% in 2005 and 33.3% in 2004. As
illustrated in Note 10 to the consolidated financial statements, the effective income tax rate for 2006 varies from
the federal statutory tax rate of 35% primarily due to state income taxes, non-deductible stock-based
compensation expense recorded for incentive stock option (“ISO”) awards offset by the benefit arising for ISO
disqualifying dispositions, the impact of our election during the third quarter of 2006 of the indefinite reversal
criteria for unremitted foreign earnings under APB No. 23, Accounting for Income Taxes—Special Areas (“APB
23”), the impact of adjusting our deferred tax asset associated with state operating loss carryforwards, the impact
of recognizing an increase to our available research and development credit, as well as the impact of recognition
of a valuation allowance to offsetting foreign deferred tax assets relating to our acquisition of CMT. The
effective income tax rates for 2005 and 2004 vary from the federal statutory tax rate of 35% primarily due to
state income taxes. In 2004, the rate was also impacted by a reduction to the valuation allowance for our deferred
tax assets and the impact of revising the rate used to measure our deferred taxes.
As of December 31, 2006 and 2005, our net deferred income tax assets totaled $10.3 million and $22.7
million, respectively. In the years ended December 31, 2006, 2005 and 2004 we recorded $12.1 million, $14.2
million and $10.2 million in income tax expense, respectively, which, as a result of our U.S. net operating loss
carryforwards, will not result in cash payments for U.S. federal income taxes other than federal alternative
minimum taxes. We have made current tax payments to state and foreign jurisdictions.
Liquidity and Capital Resources
Cash and Liquidity
Our business involves collecting and processing large volumes of cash, most of it in the form of coins. We
present three categories of cash on our balance sheet: cash and cash equivalents, cash in machine or in transit,
and cash being processed.
As of December 31, 2006, we had cash and cash equivalents, cash in machine or in transit, and cash being
processed totaling $178.2 million, which consisted of cash and cash equivalents immediately available to fund
our operations of $24.7 million, cash in machine or in transit of $63.7 million and cash being processed of $89.7
million. Cash in machine or in transit represents coin residing in our coin-counting or entertainment services
machines or being processed by carriers which is not immediately available to us until it has been collected and
deposited. Cash being processed represents coin residing in our coin-counting or entertainment services machines
or being processed by carriers which we are mainly obligated to use to settle our accrued liabilities payable to our
retailer partners. Working capital was $73.1 million at December 31, 2006, compared with $101.2 million at
December 31, 2005. The decrease in working capital was primarily the result of the timing of payments to our
vendors and retailers.
Net cash provided by operating activities was $115.4 million for the year ended December 31, 2006,
compared to net cash provided by operating activities of $103.1 million for the year ended December 31, 2005.
Cash provided by operating activities increased as a result of an increase in cash provided by our operating assets
and liabilities of $5.4 million, mainly due to the timing of payments to our retailers, and an increase in cash
provided from a net increase of non-cash transactions on our consolidated income statement of $10.5 million,
mostly from increases in depreciation and other expense and amortization of intangible assets acquired from
acquisitions.
Net cash used by investing activities for the year ended December 31, 2006 was $89.0 million compared to
$84.6 million in the prior year period. In 2006 net cash used by investing activities consisted of net equity
29