Redbox 2006 Annual Report Download - page 29
Download and view the complete annual report
Please find page 29 of the 2006 Redbox annual report below. You can navigate through the pages in the report by either clicking on the pages listed below, or by using the keyword search tool below to find specific information within the annual report.-
 1
1 -
2
-
3
-
4
-
5
-
6
-
7
-
8
-
9
-
10
-
11
-
12
-
13
-
14
-
15
-
16
-
17
-
18
-
 19
19 -
 20
20 -
 21
21 -
 22
22 -
 23
23 -
 24
24 -
 25
25 -
 26
26 -
 27
27 -
 28
28 -
 29
29 -
 30
30 -
 31
31 -
 32
32 -
 33
33 -
 34
34 -
 35
35 -
 36
36 -
 37
37 -
 38
38 -
 39
39 -
40
-
41
-
42
-
43
-
44
-
45
-
46
-
47
-
48
-
49
-
50
-
51
-
52
-
53
-
54
-
55
-
56
-
57
-
58
-
59
-
60
-
61
-
62
-
63
-
64
-
65
-
66
-
67
-
68
-
69
-
70
-
71
-
72
-
73
-
74
-
75
-
76
 |
 |
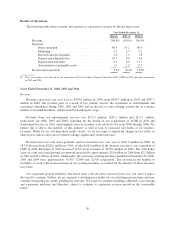
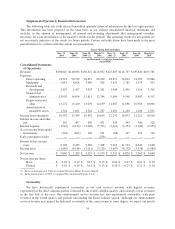
Expenses
Direct Operating Expenses
Direct operating expenses for our 4th Wall product and service offerings consist of expenses associated with
our coin-counting, entertainment services and e-payment services operations and support, as follows:
For coin-counting services and e-payment services, these expenses consist primarily of the cost of (1) the
percentage of transaction fees we pay to our retailers, (2) coin pick-up, transportation and processing expenses
and (3) field operations support and related expenses. Variations in the percentage of transaction fees we pay to
our retailers may result in increased expenses. Such variations are based on our evaluation of certain factors with
the retailer, such as total revenue, e-payment capabilities, long-term non-cancelable contracts, installation of our
machines in high traffic and/or urban or rural locations, new product commitments, co-op marketing incentive or
other criteria.
For entertainment services, these expenses consist primarily of (1) the fees we pay our retailers as
commissions and for the placement of machines, (2) the cost of plush toys and other products dispensed from the
skill-crane and bulk-vending machines and (3) field operations support and related expenses.
Direct operating expenses increased to $355.4 million in 2006, of which $8.5 million was due to our
acquisition of CMT and $1.1 million represents the incremental expenses due to the adoption of SFAS 123R,
from $309.2 million in 2005 and $186.9 million in 2004. Direct operating expenses further increased due to
expenses incurred to support our increased year over year revenues and the acquisitions of our entertainment
subsidiaries. The addition of our entertainment companies to our 4th Wall products and services offerings has
added inventory and related freight cost to our direct operating expenses, which we do not incur for our coin-
counting services. In addition, during the fourth quarter of 2006, we recorded $1.6 million of expense for the
proposed settlement of a recently filed lawsuit alleging wage and hour violations under the California labor code.
The lawsuit was originated primarily from the employment practices of the acquired entertainment subsidiary
prior to the acquisition, of which we made no admission of liability.
Direct operating expenses as a percentage of revenue was 66.5% in 2006, 67.2% in 2005 and 60.9% in
2004. We are integrating our various business operations and have realized operating expense efficiencies as a
percentage of revenue in 2006. For example, as a result of consolidating our field service routes in 2006, we have
begun to improve efficiencies and cost savings in personnel, auto, fuel and related costs which we expect to
continue in 2007.
Marketing
Our marketing expenses consist primarily of marketing, advertising and public relations efforts in existing
market regions and startup marketing expenses incurred to launch our services in new regional markets.
Marketing expenses increased to $14.4 million in 2006, of which $1.5 million was due to our acquisition of
CMT, from $10.7 million in 2005 and $12.9 million in 2004. During 2006, we directed most of our advertising
dollars toward national cable broadcasting and magazine advertising. We have been using advertising to
introduce e-payment features on our coin-counting machines and other e-payment product channels such as our
stored value card offerings. This directed marketing and advertising approach, which we expect to continue in
2007, continues driving increased trial and repeat usage of both our coin services offering and e-payment
products. Marketing as a percentage of revenue was 2.7% in 2006, 2.3% in 2005 and 4.2% in 2004.
Research and Development
Our research and development expenses consist primarily of development costs of our coin-counting
machine software, network applications, machine improvements and new product development.
27