Redbox 2006 Annual Report Download - page 28
Download and view the complete annual report
Please find page 28 of the 2006 Redbox annual report below. You can navigate through the pages in the report by either clicking on the pages listed below, or by using the keyword search tool below to find specific information within the annual report.-
 1
1 -
2
-
3
-
4
-
5
-
6
-
7
-
8
-
9
-
10
-
11
-
12
-
13
-
14
-
15
-
16
-
17
-
 18
18 -
 19
19 -
 20
20 -
 21
21 -
 22
22 -
 23
23 -
 24
24 -
 25
25 -
 26
26 -
 27
27 -
 28
28 -
 29
29 -
 30
30 -
 31
31 -
 32
32 -
 33
33 -
 34
34 -
 35
35 -
 36
36 -
 37
37 -
 38
38 -
39
-
40
-
41
-
42
-
43
-
44
-
45
-
46
-
47
-
48
-
49
-
50
-
51
-
52
-
53
-
54
-
55
-
56
-
57
-
58
-
59
-
60
-
61
-
62
-
63
-
64
-
65
-
66
-
67
-
68
-
69
-
70
-
71
-
72
-
73
-
74
-
75
-
76
 |
 |

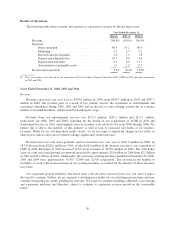
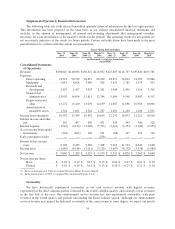
Results of Operations
The following table shows revenue and expenses as a percent of revenue for the last three years:
Year Ended December 31,
2006 (1) 2005 (1) 2004 (1)
Revenue .......................................... 100.0% 100.0% 100.0%
Expenses:
Direct operating ................................ 66.5 67.2 60.9
Marketing ..................................... 2.7 2.3 4.2
Research and development ........................ 1.0 1.2 1.8
General and administrative ........................ 10.3 8.0 8.9
Depreciation and other ........................... 9.9 9.9 11.5
Amortization of intangible assets ................... 1.1 1.0 0.7
Income from operations .............................. 8.5% 10.4% 12.0%
(1) These percentages were affected by our acquisition of Travelex Money Transfer Limited in 2006, ACMI in 2004 and other acquisitions
in 2005 and 2004.
Years Ended December 31, 2006, 2005 and 2004
Revenue
Revenues increased year over year to $534.4 million in 2006, from $459.7 million in 2005 and $307.1
million in 2004. Our revenue grew as a result of two primary factors, the acquisition of entertainment and
e-payment subsidiaries during 2006, 2005 and 2004 and an increase in coin-counting activity due to a greater
number of installed machines, and increased trial and repeat usage.
Revenue from our entertainment services was $273.5 million, $239.1 million and $111.1 million,
respectively for 2006, 2005 and 2004. Adjusting for the timing of our acquisitions of ACMI in 2004 and
Amusement Factory in 2005, entertainment services revenues were relatively flat from 2004 through 2006. We
believe this is due to the maturity of this industry as well as lack of increased foot traffic at our retailers’
locations. While we are watching these trends closely, we do not expect a significant change in foot traffic or
other factors which could cause revenue to change significantly in the near term.
Revenue from our coin and e-payment services increased year over year to $261.0 million in 2006, an
18.3% increase from $220.6 million in 2005, of which $9.0 million of the increase was due to our acquisition of
CMT in 2006. Revenues in 2005 increased 12.6% from revenues of $196.0 million in 2004. The total dollar
value of coins processed through our network increased to approximately $2.6 billion in 2006 from $2.3 billion
in 2005 and $2.2 billion in 2004. Additionally, the total coin-counting machines installed at December 31, 2006,
2005 and 2004 were approximately 13,500, 12,800 and 12,100, respectively. The increase in the number of
machines, as well as the increased usage of our existing machines, accounted for the majority of these increases
in revenue.
Our e-payment prepaid telephony and stored value card sales have increased year over year and we expect
this trend to continue. Further, we are currently evaluating price points for our entertainment machines and may
consider increasing price points pending the outcome. We expect to continue installing additional coin-counting
and e-payment machines and therefore, expect to continue to experience revenue growth in the foreseeable
future.
26