Redbox 2006 Annual Report Download - page 36
Download and view the complete annual report
Please find page 36 of the 2006 Redbox annual report below. You can navigate through the pages in the report by either clicking on the pages listed below, or by using the keyword search tool below to find specific information within the annual report.-
 1
1 -
2
-
3
-
4
-
5
-
6
-
7
-
8
-
9
-
10
-
11
-
12
-
13
-
14
-
15
-
16
-
17
-
18
-
19
-
20
-
21
-
22
-
23
-
24
-
25
-
 26
26 -
 27
27 -
 28
28 -
 29
29 -
 30
30 -
 31
31 -
 32
32 -
 33
33 -
 34
34 -
 35
35 -
 36
36 -
 37
37 -
 38
38 -
 39
39 -
 40
40 -
 41
41 -
 42
42 -
 43
43 -
 44
44 -
 45
45 -
 46
46 -
47
-
48
-
49
-
50
-
51
-
52
-
53
-
54
-
55
-
56
-
57
-
58
-
59
-
60
-
61
-
62
-
63
-
64
-
65
-
66
-
67
-
68
-
69
-
70
-
71
-
72
-
73
-
74
-
75
-
76
 |
 |

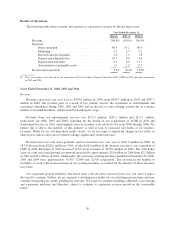
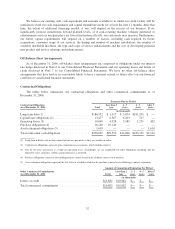
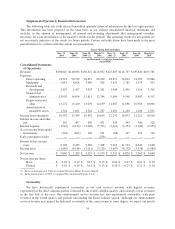
Supplemental Quarterly Financial Information
The following table sets forth selected unaudited quarterly financial information for the last eight quarters.
This information has been prepared on the same basis as our audited consolidated financial statements and
includes, in the opinion of management, all normal and recurring adjustments that management considers
necessary for a fair presentation of the quarterly results for the periods. The operating results for any quarter are
not necessarily indicative of the results for future periods. Certain reclassifications have been made to the prior
period balances to conform with the current year presentation.
Three Month Periods Ended
Dec. 31,
2006
Sept. 30,
2006
June 30,
2006 (1)
March 31,
2006
Dec. 31,
2005 (2)
Sept. 30,
2005
June 30,
2005
March 31,
2005
(in thousands, except per share data)
(unaudited)
Consolidated Statements
of Operations:
Revenue ................ $138,047 $140,036 $130,327 $126,032 $125,607 $118,707 $109,840 $105,585
Expenses:
Direct operating ...... 91,923 90,719 86,437 86,299 83,871 78,022 74,389 72,880
Marketing .......... 5,481 4,626 3,389 924 5,031 2,785 1,975 957
Research and
development ...... 1,155 1,457 1,393 1,241 1,446 1,445 1,516 1,309
General and
administrative ..... 13,902 14,654 13,811 12,766 9,800 9,546 8,687 8,592
Depreciation and
other ............. 13,272 13,410 13,295 12,859 11,887 11,696 10,958 10,806
Amortization of
intangible assets .... 1,722 1,661 1,510 1,327 1,281 1,140 1,104 1,031
Income from operations . . . 10,592 13,509 10,492 10,616 12,291 14,073 11,211 10,010
Interest income and other,
net .................. 165 487 420 471 426 345 380 326
Interest expense .......... (3,910) (4,120) (3,986) (3,732) (3,613) (3,353) (3,100) (2,850)
(Loss) income from equity
investments ........... (118) (443) 304 191 (88) 127 152 162
Early retirement of debt . . .———(238) ————
Income before income
taxes ................. 6,729 9,433 7,230 7,308 9,016 11,192 8,643 7,648
Income taxes ............ (1,689) (4,144) (3,111) (3,129) (3,497) (4,372) (3,378) (2,980)
Net income ............. $ 5,040 $ 5,289 $ 4,119 $ 4,179 $ 5,519 $ 6,820 $ 5,265 $ 4,668
Net income per share:
Basic .............. $ 0.18 $ 0.19 $ 0.15 $ 0.15 $ 0.20 $ 0.27 $ 0.21 $ 0.18
Diluted ............. $ 0.18 $ 0.19 $ 0.15 $ 0.15 $ 0.20 $ 0.27 $ 0.21 $ 0.18
(1) In the second quarter of 2006, we acquired Travelex Money Transfer Limited.
(2) In the fourth quarter of 2005, we acquired The Amusement Factory L.L.C.
Seasonality
We have historically experienced seasonality in our coin services revenue, with highest revenues
experienced in the third calendar quarter, followed by the fourth calendar quarter, and relatively lower revenues
in the first half of the year. Our entertainment service revenue has also experienced seasonality, with peak
revenues in the fourth quarter and periods surrounding the Easter holiday season. Although our entertainment
services revenue may impact the historical seasonality of the coin revenue to some degree, we expect our results
34