Redbox 2006 Annual Report Download - page 30
Download and view the complete annual report
Please find page 30 of the 2006 Redbox annual report below. You can navigate through the pages in the report by either clicking on the pages listed below, or by using the keyword search tool below to find specific information within the annual report.-
 1
1 -
2
-
3
-
4
-
5
-
6
-
7
-
8
-
9
-
10
-
11
-
12
-
13
-
14
-
15
-
16
-
17
-
18
-
19
-
 20
20 -
 21
21 -
 22
22 -
 23
23 -
 24
24 -
 25
25 -
 26
26 -
 27
27 -
 28
28 -
 29
29 -
 30
30 -
 31
31 -
 32
32 -
 33
33 -
 34
34 -
 35
35 -
 36
36 -
 37
37 -
 38
38 -
 39
39 -
 40
40 -
41
-
42
-
43
-
44
-
45
-
46
-
47
-
48
-
49
-
50
-
51
-
52
-
53
-
54
-
55
-
56
-
57
-
58
-
59
-
60
-
61
-
62
-
63
-
64
-
65
-
66
-
67
-
68
-
69
-
70
-
71
-
72
-
73
-
74
-
75
-
76
 |
 |
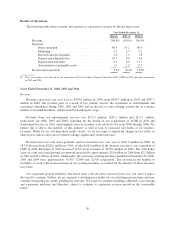
Research and development expenses have remained relatively consistent. Our research and development
expenses were $5.2 million in 2006, $5.7 million in 2005 and $5.5 million in 2004. Research and development
expenses represent expenditures to support development and design of complementary new product ideas and
continue our ongoing efforts to enhance our existing products and services, primarily our coin-counting system.
It is our intent to continue to invest in research and development in the coming years. Since revenues have
increased significantly and our research and development expenditures remained relatively consistent, research
and development as a percentage of revenue has been decreasing to 1.0% in 2006 from 1.2% in 2005 and 1.8% in
2004.
General and Administrative
Our general and administrative expenses consist primarily of administrative support for field operations,
customer service, systems and engineering support, computer network operations, finance, human resources,
occupancy expenses, legal expenses and insurance.
General and administrative expenses increased to $55.1 million in 2006, of which $3.7 million was due to our
acquisition of CMT and $4.0 million represents the incremental expense due to the adoption of SFAS 123R, from
$36.6 million in 2005 and $27.5 million in 2004. General and administrative expenses further increased due to the
acquisitions of our entertainment subsidiaries and the incremental cost of supporting subsidiary companies with
regional offices throughout the United States and in the United Kingdom. Although we expect our general and
administrative expenses for stock options and CMT to moderately increase for the foreseeable future, we will continue
to strive for additional synergies as a result of efficiencies gained from our integrations. General and administrative
expense as a percentage of revenue has increased to 10.3% in 2006 from 8.0% in 2005 and 8.9% in 2004.
Depreciation and Other
Our depreciation and other expenses consist primarily of depreciation charges on our installed coin-counting
and entertainment services machines and depreciation on computer equipment and leased automobiles.
Depreciation and other expense increased to $52.8 million in 2006, from $45.3 million in 2005 and $35.3
million in 2004. Depreciation and other expense increased year over year primarily due to our increased installed
entertainment machine counts from our acquisitions. Depreciation and other expense as a percentage of revenue
was 9.9% in 2006 and 2005, and 11.5% in 2004.
Amortization of Intangible Assets
Our amortization expense consists of amortization of intangible assets including retailer relationships that
were valued in connection with our acquisitions.
Amortization of intangible assets increased to $6.2 million in 2006, which $0.9 million was due to our
acquisition of CMT, from $4.6 million in 2005 and $2.0 million in 2004. Amortization expense of intangible
assets increased due to our acquisitions in 2006, 2005 and 2004. Our intangible assets are mainly composed of
the value assigned to acquired retailer relationships and, to a lesser extent, acquired internally developed software
from acquisitions. Amortization expense as a percentage of revenue increased to 1.1% in 2006 from 1.0% in
2005 and 0.7% in 2004.
Other Income and Expense
Interest income and other, net, was $1.5 million in 2006 and 2005 and $0.3 million in 2004. The increase in
2005 from 2004 was the result of interest earned on the cash proceeds of $81.6 million in connection with our
common stock offering in December 2004.
28