Qantas 2007 Annual Report Download - page 98
Download and view the complete annual report
Please find page 98 of the 2007 Qantas annual report below. You can navigate through the pages in the report by either clicking on the pages listed below, or by using the keyword search tool below to find specific information within the annual report.-
 1
1 -
2
-
3
-
4
-
5
-
6
-
7
-
8
-
9
-
10
-
11
-
12
-
13
-
14
-
15
-
16
-
17
-
18
-
19
-
20
-
21
-
22
-
23
-
24
-
25
-
26
-
27
-
28
-
29
-
30
-
31
-
32
-
33
-
34
-
35
-
36
-
37
-
38
-
39
-
40
-
41
-
42
-
43
-
44
-
45
-
46
-
47
-
48
-
49
-
50
-
51
-
52
-
53
-
54
-
55
-
56
-
57
-
58
-
59
-
60
-
61
-
62
-
63
-
64
-
65
-
66
-
67
-
68
-
69
-
70
-
71
-
72
-
73
-
74
-
75
-
76
-
77
-
78
-
79
-
80
-
81
-
82
-
83
-
84
-
85
-
86
-
87
-
 88
88 -
 89
89 -
 90
90 -
 91
91 -
 92
92 -
 93
93 -
 94
94 -
 95
95 -
 96
96 -
 97
97 -
 98
98 -
 99
99 -
 100
100 -
 101
101 -
 102
102 -
 103
103 -
 104
104 -
 105
105 -
 106
106 -
 107
107 -
 108
108 -
109
-
110
-
111
-
112
-
113
-
114
-
115
-
116
-
117
-
118
-
119
-
120
-
121
-
122
-
123
-
124
-
125
-
126
-
127
-
128
-
129
-
130
-
131
-
132
-
133
-
134
-
135
-
136
-
137
-
138
-
139
-
140
-
141
-
142
-
143
-
144
 |
 |

96 Qantas |Annual Report 2007
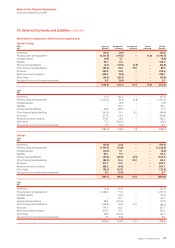
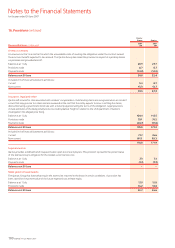
Qantas Group
Asset Liability Net
2007
$M
2006
$M
2007
$M
2006
$M
2007
$M
2006
$M
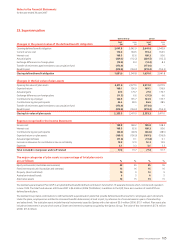
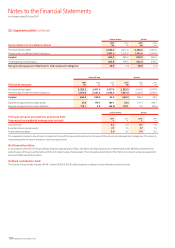
Inventories ––(50.3) (47.3) (50.3) (47.3)
Property, plant and equipment ––(1,340.7) (1,231.4) (1,340.7) (1,231.4)
Intangible assets ––(4.8) (9.9) (4.8) (9.9)
Payables ––106.3 94.7 106.3 94.7
Interest-bearing liabilities ––(42.6) (2.1) (42.6) (2.1)
Other financial assets/liabilities ––89.0 (84.6) 89.0 (84.6)
Provisions ––258.6 239.8 258.6 239.8
Revenue received in advance ––383.7 393.3 383.7 393.3
Other items 0.3 2.9 (79.9) (62.2) (79.6) (59.3)
Tax value of loss carry-forwards recognised ––5.1 8.5 5.1 8.5
Net tax assets/(liabilities) 0.3 2.9 (675.6) (701.2) (675.3) (698.3)
Qantas
Liability Net
2007
$M
2006
$M
2007
$M
2006
$M
Inventories (50.3) (47.9) (50.3) (47.9)
Property, plant and equipment (1,229.9) (1,157.1) (1,229.9) (1,157.1)
Intangible assets (5.2) (10.3) (5.2) (10.3)
Payables 99.6 90.1 99.6 90.1
Interest-bearing liabilities (130.1) (57.2) (130.1) (57.2)
Other financial assets/liabilities 89.0 (84.5) 89.0 (84.5)
Provisions 230.7 211.7 230.7 211.7
Revenue received in advance 383.7 393.3 383.7 393.3
Other items (73.2) (52.1) (73.2) (52.1)
Tax value of loss carry-forwards recognised 5.1 8.5 5.1 8.5
Net tax liabilities (680.6) (705.5) (680.6) (705.5)
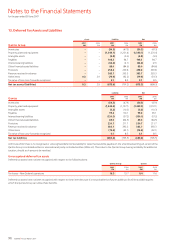
At 30 June 2007, there is no recognised or unrecognised deferred tax liability for taxes that would be payable on the unremitted earnings of certain of the
Qantas Group’s controlled entities or associates and jointly controlled entities (2006: nil). This is due to the Qantas Group having no liability for additional
taxation, should such amounts be remitted.
Unrecognised deferred tax assets
Deferred tax assets have not been recognised with respect to the following items:
Qantas Group Qantas
2007
$M
2006
$M
2007
$M
2006
$M
Tax losses – New Zealand operations 16.3 13.7 8.4 11.6
Deferred tax assets have not been recognised with respect to these items because it is not probable that future taxable profit will be available against
which the Qantas Group can utilise these benefits.
13. Deferred Tax Assets and Liabilities
Notes to the Financial Statements
for the year ended 30 June 2007