Qantas 2007 Annual Report Download - page 69
Download and view the complete annual report
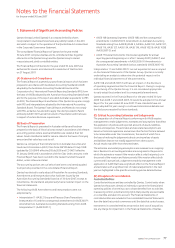
Please find page 69 of the 2007 Qantas annual report below. You can navigate through the pages in the report by either clicking on the pages listed below, or by using the keyword search tool below to find specific information within the annual report.-
 1
1 -
2
-
3
-
4
-
5
-
6
-
7
-
8
-
9
-
10
-
11
-
12
-
13
-
14
-
15
-
16
-
17
-
18
-
19
-
20
-
21
-
22
-
23
-
24
-
25
-
26
-
27
-
28
-
29
-
30
-
31
-
32
-
33
-
34
-
35
-
36
-
37
-
38
-
39
-
40
-
41
-
42
-
43
-
44
-
45
-
46
-
47
-
48
-
49
-
50
-
51
-
52
-
53
-
54
-
55
-
56
-
57
-
58
-
 59
59 -
 60
60 -
 61
61 -
 62
62 -
 63
63 -
 64
64 -
 65
65 -
 66
66 -
 67
67 -
 68
68 -
 69
69 -
 70
70 -
 71
71 -
 72
72 -
 73
73 -
 74
74 -
 75
75 -
 76
76 -
 77
77 -
 78
78 -
 79
79 -
80
-
81
-
82
-
83
-
84
-
85
-
86
-
87
-
88
-
89
-
90
-
91
-
92
-
93
-
94
-
95
-
96
-
97
-
98
-
99
-
100
-
101
-
102
-
103
-
104
-
105
-
106
-
107
-
108
-
109
-
110
-
111
-
112
-
113
-
114
-
115
-
116
-
117
-
118
-
119
-
120
-
121
-
122
-
123
-
124
-
125
-
126
-
127
-
128
-
129
-
130
-
131
-
132
-
133
-
134
-
135
-
136
-
137
-
138
-
139
-
140
-
141
-
142
-
143
-
144
 |
 |

67Qantas |Annual Report 2007
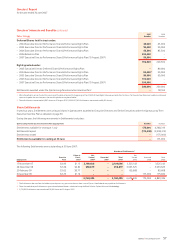
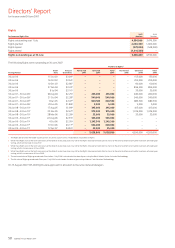
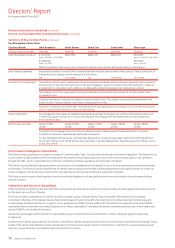
Directors’ Report
for the year ended 30 June 2007
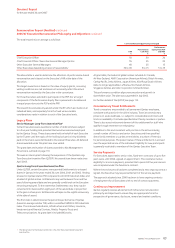
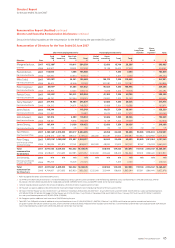
RemunerationofKeyManagementExecutivesfortheYearEnded30June2007continued
Equity Settled
1Share-Based Payment Year
PSP
$
PRP
$
Sen Mgr LTI
$
RP
$
Total
$
John Borghetti 2007 288,858 170,353 46,800 430,317 936,328
2006 217,715 125,032 92,800 – 435,547
Kevin Brown 2007 136,950 105,368 35,100 376,527 653,945
2006 130,256 86,165 69,600 – 286,021
David Cox 2007 115,868 95,321 17,786 376,527 605,502
2006 111,647 75,636 35,273 – 222,556
Grant Fenn 2007 136,950 109,338 35,100 376,527 657,915
2006 130,256 94,348 69,600 – 294,204
Alan Joyce 2007 142,861 101,397 17,786 376,527 638,571
2006 188,052 73,518 35,273 – 296,843
Total 2007 821,487 581,777 152,572 1,936,425 3,492,261
2006 777,926 454,699 302,546 – 1,535,171
Directors’ and Officers’ liability insurance has not been included in the above figures since it is not possible to determine an appropriate allocation basis.
Executives are assumed to use their annual leave benefit in any year and any leave not taken at termination will be reflected in their termination benefit.
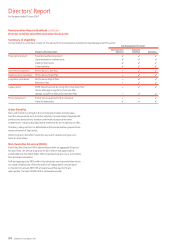
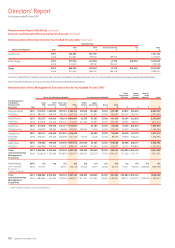
Performance Related Remuneration FAR & Other1Total
Cash-Based Equity-Based
Remuneration Components as a Proportion of Total Remuneration PCP
PSP, RP
&Sen
Mgr LTI2PRP Total
Geoff Dixon 43% 8% 9% 60% 40% 100%
Peter Gregg 36% 20% 5% 61% 39% 100%
John Borghetti 34% 19% 4% 57% 43% 100%
Kevin Brown 28% 24% 5% 57% 43% 100%
David Cox 27% 27% 5% 59% 41% 100%
Grant Fenn 28% 24% 5% 57% 43% 100%
Alan Joyce 29% 21% 4% 54% 46% 100%
Other Remuneration consists of travel entitlements, the annual accrual of end of service payments and other benefits.
In the case of Mr Dixon and Mr Gregg, this was the 2002 Executive Director Long-Term Incentive Plan.
The total percentages are derived from the remuneration tables on pages 65 to 66. As the remuneration table is prepared on an accrual basis and the
equity benefit is valued at grant date in accordance with Accounting Standards, the percentages disclosed do not reflect the annual allocation
of performance related remuneration. To understand the target annual reward mixes of each of the Executives, refer to page 63.
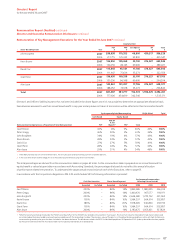
In accordance with the Corporations Regulations 2M.3.03 and Schedule 5B the following information is provided:
Cash Plan Incentive Share-Based Payment
Performance Remuneration
Affecting Future Periods1
Awarded Forfeited Awarded Forfeited 2008 2009 2010
Geoff Dixon 200% – 86% 14% 1,899,586 1,080,005 356,914
Peter Gregg 200% – 86% 14% 1,400,670 967,577 118,971
John Borghetti 200% – 86% 14% 2,644,580 1,270,752 391,060
Kevin Brown 195% – 84% 16% 1,964,297 964,914 302,857
David Cox 186% – 80% 20% 1,918,605 940,800 292,150
Grant Fenn 195% – 84% 16% 1,964,297 964,914 302,857
Alan Joyce 200% – 86% 14% 2,183,475 1,053,431 337,829
Performance remuneration granted under the Performance Equity Plan for the 2006/07 year provides remuneration in future years. The maximum value has been determined at grant date based
on anticipated performance hurdles and amortised in accordance with the accounting standard. The minimum value of the grant is nil should performance conditions not be satisfied. Performance
remuneration granted in prior years has been included in the above disclosure. This disclosure includes the 2007 final dividend payable on 26 September 2007 (and any related distributions payable
by the Qantas Deferred Share Plan Trustee) but does not include future dividends yet to be declared.
1
2
1
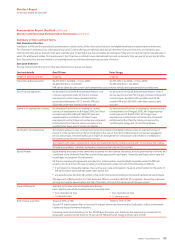
Remuneration Report (Audited) continued
Director and Executive Remuneration Disclosures continued