Qantas 2007 Annual Report Download - page 74
Download and view the complete annual report
Please find page 74 of the 2007 Qantas annual report below. You can navigate through the pages in the report by either clicking on the pages listed below, or by using the keyword search tool below to find specific information within the annual report.-
 1
1 -
2
-
3
-
4
-
5
-
6
-
7
-
8
-
9
-
10
-
11
-
12
-
13
-
14
-
15
-
16
-
17
-
18
-
19
-
20
-
21
-
22
-
23
-
24
-
25
-
26
-
27
-
28
-
29
-
30
-
31
-
32
-
33
-
34
-
35
-
36
-
37
-
38
-
39
-
40
-
41
-
42
-
43
-
44
-
45
-
46
-
47
-
48
-
49
-
50
-
51
-
52
-
53
-
54
-
55
-
56
-
57
-
58
-
59
-
60
-
61
-
62
-
63
-
 64
64 -
 65
65 -
 66
66 -
 67
67 -
 68
68 -
 69
69 -
 70
70 -
 71
71 -
 72
72 -
 73
73 -
 74
74 -
 75
75 -
 76
76 -
 77
77 -
 78
78 -
 79
79 -
 80
80 -
 81
81 -
 82
82 -
 83
83 -
 84
84 -
85
-
86
-
87
-
88
-
89
-
90
-
91
-
92
-
93
-
94
-
95
-
96
-
97
-
98
-
99
-
100
-
101
-
102
-
103
-
104
-
105
-
106
-
107
-
108
-
109
-
110
-
111
-
112
-
113
-
114
-
115
-
116
-
117
-
118
-
119
-
120
-
121
-
122
-
123
-
124
-
125
-
126
-
127
-
128
-
129
-
130
-
131
-
132
-
133
-
134
-
135
-
136
-
137
-
138
-
139
-
140
-
141
-
142
-
143
-
144
 |
 |

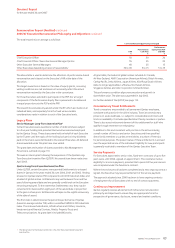
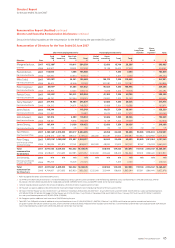
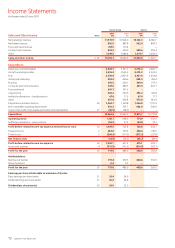
72 Qantas |Annual Report 2007
Qantas Group Qantas
Sales and Other Income Notes
2007
$M
2006
$M
2007
$M
2006
$M
Net passenger revenue 11,911.9 10,504.0 10,122.3 8,982.7
Net freight revenue 902.5 887.8 902.0 887.2
Tours and travel revenue 767.5 719.4 ––
Contract work revenue 434.3 469.0 348.6 359.4
Other 1,149.5 1,080.4 1,317.7 1,096.4
Sales and other income 2, 30 15,165.7 13,660.6 12,690.6 11,325.7
Expenditure
Manpower and staff related 3,334.7 3,321.7 2,715.2 2,681.1
Aircraft operating variable 2,616.4 2,525.3 2,373.2 2,229.0
Fuel 3,336.8 2,802.3 2,927.0 2,434.8
Selling and marketing 503.4 469.6 488.5 457.4
Property 350.5 320.1 309.0 277.3
Computer and communication 527.0 487.5 461.5 420.7
Tours and travel 641.7 591.2 ––
Capacity hire 303.2 369.6 290.2 341.8
Ineffective derivatives – closed positions 67.6 71.3 67.6 71.3
Other 651.8 436.8 573.8 344.4
Depreciation and amortisation 30 1,362.7 1,249.8 1,266.8 1,110.0
Non-cancellable operating lease rentals 415.3 355.7 442.9 345.0
Share of net profit of associates and jointly controlled entities 27 (46.5) (38.9) ––
Expenditure 14,064.6 12,962.0 11,915.7 10,712.8
Operating result 1,101.1 698.6 774.9 612.9
Ineffective derivatives – open positions (54.1) 27.2 (54.1) 27.2
Profit before related income tax expense and net finance costs 30 1,047.0 725.8 720.8 640.1
Finance income 2 244.0 163.3 226.6 146.6
Finance costs 3(258.9) (217.9) (272.3) (227.6)
Net finance costs (14.9) (54.6) (45.7) (81.0)
Profit before related income tax expense 30 1,032.1 671.2 675.1 559.1
Income tax expense 4 (312.5) (191.2) (216.5) (167.1)
Profit for the year 30 719.6 480.0 458.6 392.0
Attributable to:
Members of Qantas 719.4 479.5 458.6 392.0
Minority interest 0.2 0.5 ––
Profit for the year 30 719.6 480.0 458.6 392.0
Earnings per share attributable to members of Qantas:
Basic earnings per share (cents) 31 36.4 24.9
Diluted earnings per share (cents) 31 36.4 24.8
Dividend per share (cents) 29 30.0 22.0
Income Statements
for the year ended 30 June 2007