Qantas 2007 Annual Report Download - page 121
Download and view the complete annual report
Please find page 121 of the 2007 Qantas annual report below. You can navigate through the pages in the report by either clicking on the pages listed below, or by using the keyword search tool below to find specific information within the annual report.-
 1
1 -
2
-
3
-
4
-
5
-
6
-
7
-
8
-
9
-
10
-
11
-
12
-
13
-
14
-
15
-
16
-
17
-
18
-
19
-
20
-
21
-
22
-
23
-
24
-
25
-
26
-
27
-
28
-
29
-
30
-
31
-
32
-
33
-
34
-
35
-
36
-
37
-
38
-
39
-
40
-
41
-
42
-
43
-
44
-
45
-
46
-
47
-
48
-
49
-
50
-
51
-
52
-
53
-
54
-
55
-
56
-
57
-
58
-
59
-
60
-
61
-
62
-
63
-
64
-
65
-
66
-
67
-
68
-
69
-
70
-
71
-
72
-
73
-
74
-
75
-
76
-
77
-
78
-
79
-
80
-
81
-
82
-
83
-
84
-
85
-
86
-
87
-
88
-
89
-
90
-
91
-
92
-
93
-
94
-
95
-
96
-
97
-
98
-
99
-
100
-
101
-
102
-
103
-
104
-
105
-
106
-
107
-
108
-
109
-
110
-
 111
111 -
 112
112 -
 113
113 -
 114
114 -
 115
115 -
 116
116 -
 117
117 -
 118
118 -
 119
119 -
 120
120 -
 121
121 -
 122
122 -
 123
123 -
 124
124 -
 125
125 -
 126
126 -
 127
127 -
 128
128 -
 129
129 -
 130
130 -
 131
131 -
132
-
133
-
134
-
135
-
136
-
137
-
138
-
139
-
140
-
141
-
142
-
143
-
144
 |
 |
119Qantas |Annual Report 2007
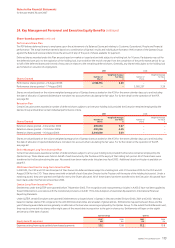
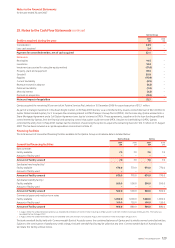
Notes to the Financial Statements
for the year ended 30 June 2007
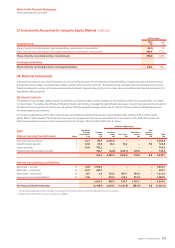
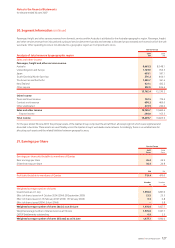
Qantas Group
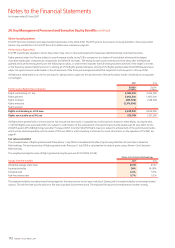
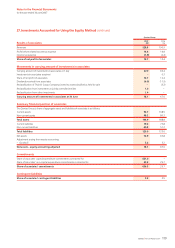
Results of associates 2007
$M
2006
$M
Revenues 228.8 190.9
Profit before related income tax expense 16.6 14.8
Income tax expense (1.9) (2.4)
Share of net profit of associates 14.7 12.4
Movements in carrying amount of investments in associates
Carrying amount of investments in associates at 1 July 67.0 69.4
Investments in associates acquired –0.3
Share of net profit of associates 14.7 12.4
Dividends received from associates (6.0) (11.9)
Reclassification of Thai Air Cargo Company Limited to assets classified as held for sale –(3.2)
Reclassification from investments in jointly controlled entities 1.0 –
Reclassification from other investments 1.4 –
Carrying amount of investments in associates at 30 June 78.1 67.0
Summary financial position of associates
The Qantas Group’s share of aggregate assets and liabilities of associates is as follows:
Current assets 96.7 108.5
Non-current assets 98.2 80.3
Total assets 194.9 188.8
Current liabilities 79.2 73.8
Non-current liabilities 40.8 51.2
Total liabilities 120.0 125.0
Net assets 74.9 63.8
Adjustment arising from equity accounting:
Goodwill –3.2 3.2
Net assets – equity accounting adjusted 78.1 67.0
Commitments
Share of associates’ capital expenditure commitments contracted for 621.0 –
Share of associates’ non-capital expenditure commitments contracted for 35.3 29.7
Share of associates’ commitments 656.3 29.7
Contingent liabilities
Share of associates’ contingent liabilities 5.2 2.5
27. Investments Accounted for Using the Equity Method continued